
Properties for sale in CM
Chelmsford
- Info
- Price Paid By Year
- Property Type Price
House Prices in CM
Properties in CM have an average house price of £451,461 and had 28020 Property Transactions within the last 3 years.
The most expensive property was sold for £12,250,000.
Property Price Paid in CM by Year
The average sold property price by year was:
| Year | Average Sold Price | Sold Properties |
|---|---|---|
| 2026 | £442,380.00 | 662 Properties |
| 2025 | £458,396.00 | 9,495 Properties |
| 2024 | £452,157.00 | 9,422 Properties |
| 2023 | £443,595.00 | 8,441 Properties |
| 2022 | £460,844.00 | 11,445 Properties |
| 2021 | £440,957.00 | 14,728 Properties |
| 2020 | £419,495.00 | 10,478 Properties |
| 2019 | £394,747.00 | 11,774 Properties |
| 2018 | £398,064.00 | 11,917 Properties |
| 2017 | £388,692.00 | 11,985 Properties |
| 2016 | £363,192.00 | 12,873 Properties |
| 2015 | £329,886.00 | 13,482 Properties |
| 2014 | £300,682.00 | 13,039 Properties |
| 2013 | £280,707.00 | 10,797 Properties |
| 2012 | £274,534.00 | 8,964 Properties |
| 2011 | £273,799.00 | 8,921 Properties |
| 2010 | £277,927.00 | 9,211 Properties |
| 2009 | £250,840.00 | 8,520 Properties |
| 2008 | £261,686.00 | 7,924 Properties |
| 2007 | £263,047.00 | 15,916 Properties |
| 2006 | £244,909.00 | 16,781 Properties |
| 2005 | £232,375.00 | 13,218 Properties |
| 2004 | £222,447.00 | 15,366 Properties |
| 2003 | £202,798.00 | 14,982 Properties |
| 2002 | £179,109.00 | 16,543 Properties |
| 2001 | £149,005.00 | 16,099 Properties |
| 2000 | £133,095.00 | 14,654 Properties |
| 1999 | £112,848.00 | 17,116 Properties |
| 1998 | £100,797.00 | 14,231 Properties |
| 1997 | £91,289.00 | 15,639 Properties |
| 1996 | £84,372.00 | 13,385 Properties |
| 1995 | £80,108.00 | 10,776 Properties |
Property Price per Property Type in CM
Here you can find historic sold price data in order to help with your property search.
The average Property Paid Price for specific property types in the last three years are:
| Property Type | Average Sold Price | Sold Properties |
|---|---|---|
| Semi Detached House | £445,171.00 | 7,572 Semi Detached Houses |
| Terraced House | £354,060.00 | 7,244 Terraced Houses |
| Detached House | £699,884.00 | 7,838 Detached Houses |
| Flat | £228,960.00 | 5,366 Flats |
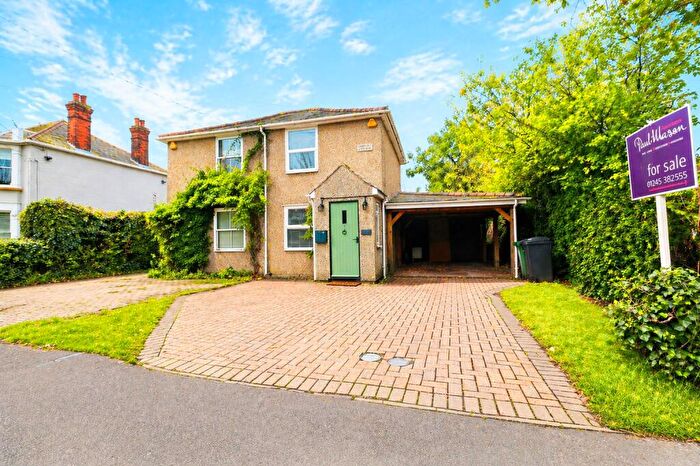
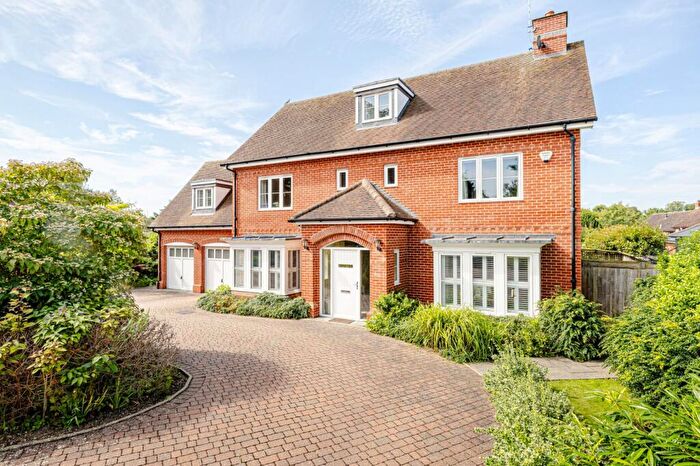
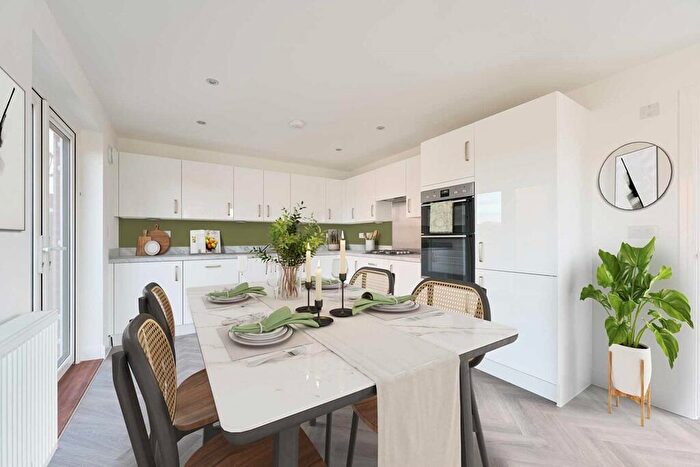
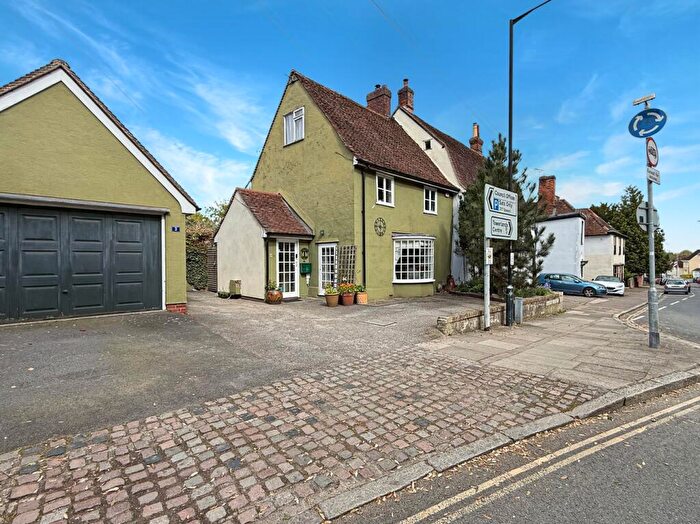
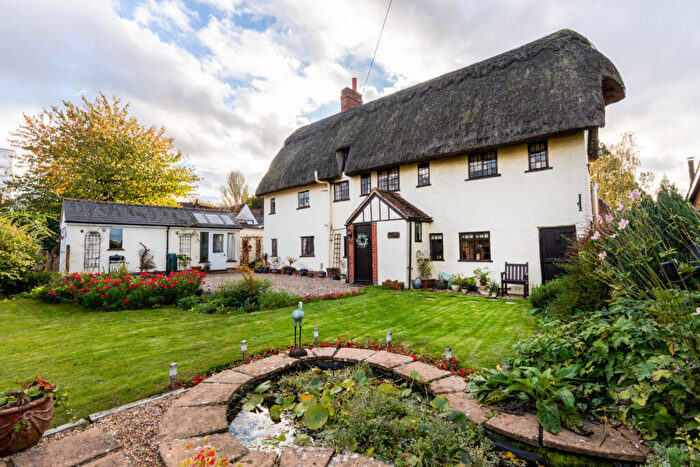
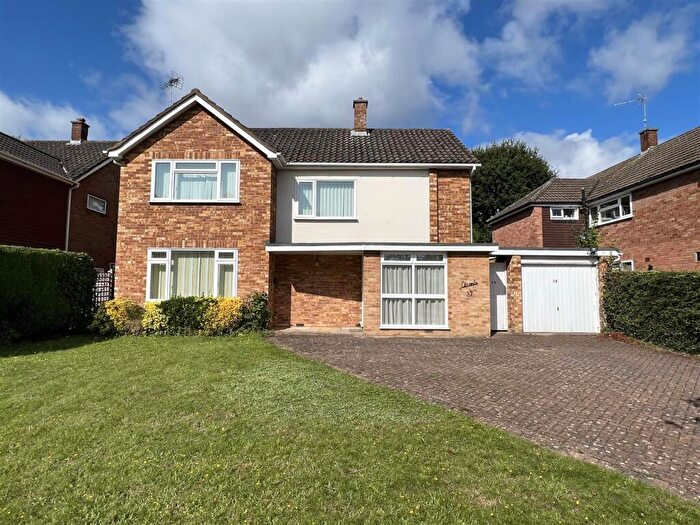
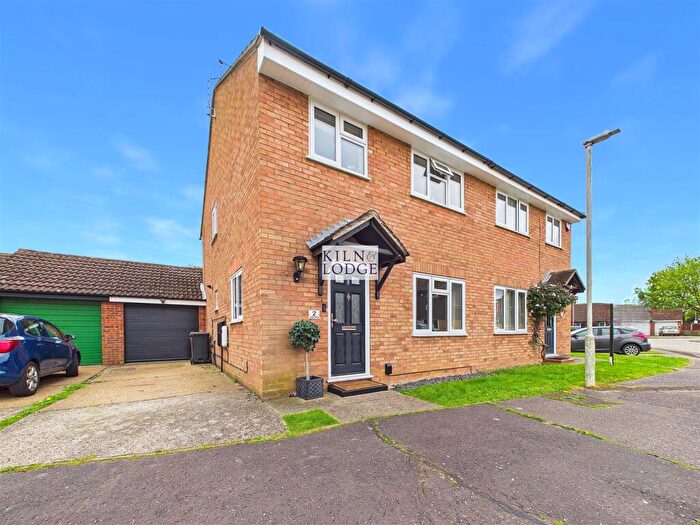
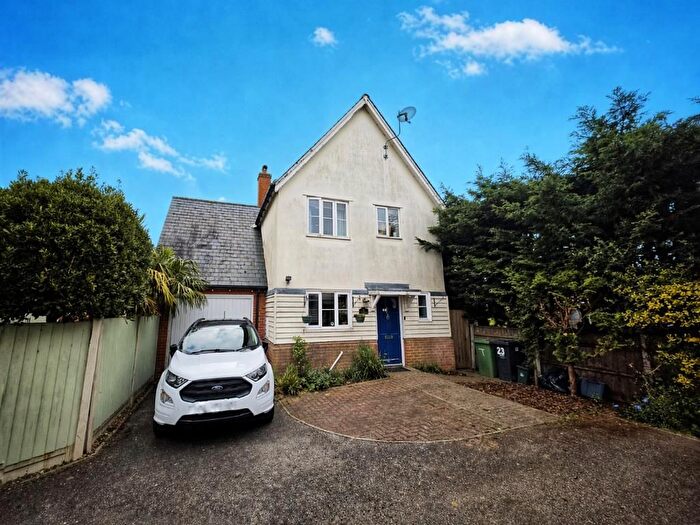
Houses and Flats for sale in CM, Chelmsford
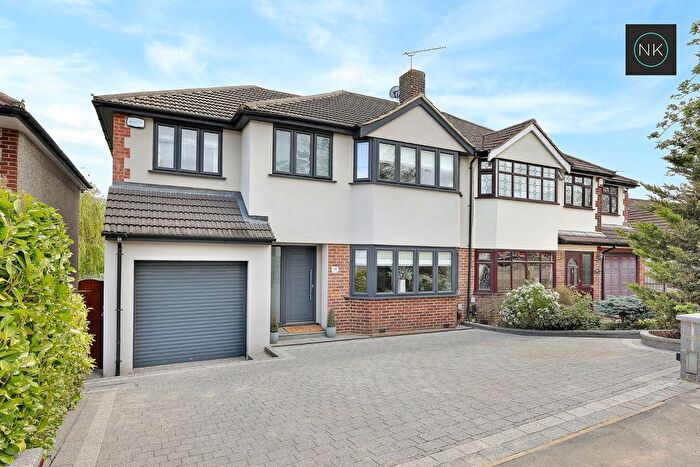
![]()
If you are looking to sell your house, let it out, or receive a property valuation, an expert can help you.
Click the button below to get started.


Postcode districts in CM, Chelmsford
Navigate through our locations to find the location of your next house in CM, Chelmsford, England for sale or to rent.
Transport in CM, Chelmsford
Please see below transportation links in this area:
-
 Chelmsford Station
 -
Ingatestone Station
-
Hatfield Peverel Station
-
Billericay Station
-
 Shenfield Station
Frequently asked questions about CM
What is the average price for a property for sale in CM?
The average price for a property for sale in CM is £451,461. This amount is 26% higher than the average price in England. There are 5,987 property listings for sale in CM.
What locations have the most expensive properties for sale in CM?
The locations with the most expensive properties for sale in CM are CM4 at an average of £796,042, CM13 at an average of £677,760 and CM16 at an average of £656,632.
What locations have the most affordable properties for sale in CM?
The locations with the most affordable properties for sale in CM are CM20 at an average of £305,629, CM18 at an average of £307,473 and CM7 at an average of £325,156.
Which train stations are available in or near CM?
Some of the train stations available in or near CM are Chelmsford, Ingatestone and Hatfield Peverel.