Properties for sale in CA15
Maryport, Dearham, Flimby, Allonby
- Info
- Price Paid By Year
- Property Type Price
- Transport
House Prices in CA15
Properties in CA15 have an average house price of £140,633.00 and had 701 Property Transactions within the last 3 years.
The most expensive property was sold for £525,000.00.
Property Price Paid in CA15 by Year
The average sold property price by year was:
| Year | Average Sold Price | Sold Properties |
|---|---|---|
| 2024 | £149,750.00 | 4 Properties |
| 2023 | £150,589.00 | 169 Properties |
| 2022 | £143,301.00 | 219 Properties |
| 2021 | £133,179.00 | 309 Properties |
| 2020 | £132,926.00 | 210 Properties |
| 2019 | £126,646.00 | 209 Properties |
| 2018 | £127,692.00 | 239 Properties |
| 2017 | £124,554.00 | 266 Properties |
| 2016 | £128,275.00 | 274 Properties |
| 2015 | £123,238.00 | 264 Properties |
| 2014 | £121,312.00 | 246 Properties |
| 2013 | £116,758.00 | 227 Properties |
| 2012 | £112,218.00 | 141 Properties |
| 2011 | £108,239.00 | 170 Properties |
| 2010 | £125,143.00 | 158 Properties |
| 2009 | £113,830.00 | 138 Properties |
| 2008 | £116,971.00 | 172 Properties |
| 2007 | £129,393.00 | 324 Properties |
| 2006 | £110,122.00 | 319 Properties |
| 2005 | £102,174.00 | 271 Properties |
| 2004 | £83,295.00 | 294 Properties |
| 2003 | £70,057.00 | 373 Properties |
| 2002 | £52,880.00 | 333 Properties |
| 2001 | £45,798.00 | 306 Properties |
| 2000 | £41,876.00 | 262 Properties |
| 1999 | £42,329.00 | 241 Properties |
| 1998 | £40,552.00 | 219 Properties |
| 1997 | £38,503.00 | 275 Properties |
| 1996 | £38,603.00 | 231 Properties |
| 1995 | £38,469.00 | 190 Properties |
Property Price per Property Type in CA15
Here you can find historic sold price data in order to help with your property search.
The average Property Paid Price for specific property types in the last three years are:
| Property Type | Average Sold Price | Sold Properties |
|---|---|---|
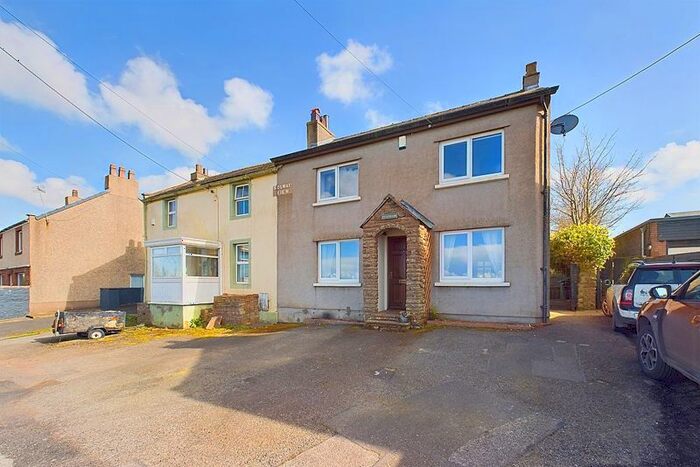
| Semi Detached House | £152,828.00 | 164 Semi Detached Houses |
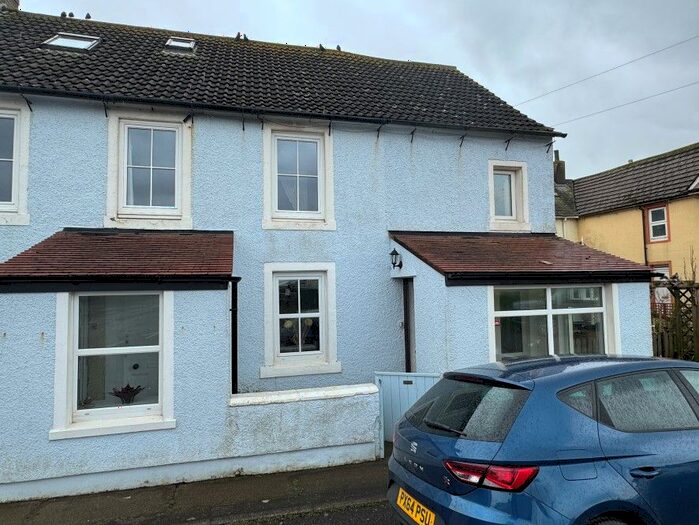
| Terraced House | £104,564.00 | 388 Terraced Houses |
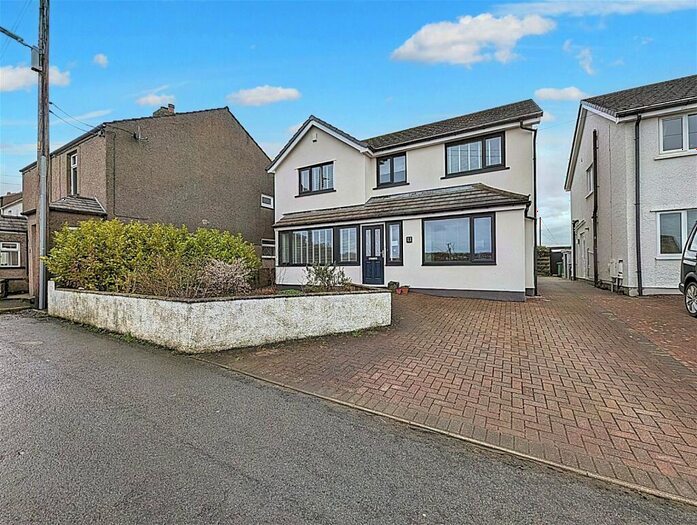
| Detached House | £235,552.00 | 134 Detached Houses |
| Flat | £92,366.00 | 15 Flats |