
Houses for sale & to rent in Harrold, Wellingborough
House Prices in Harrold
Properties in Harrold have an average house price of £476,318.00 and had 11 Property Transactions within the last 3 years¹.
Harrold is an area in Wellingborough, Bedfordshire with 164 households², where the most expensive property was sold for £1,300,000.00.
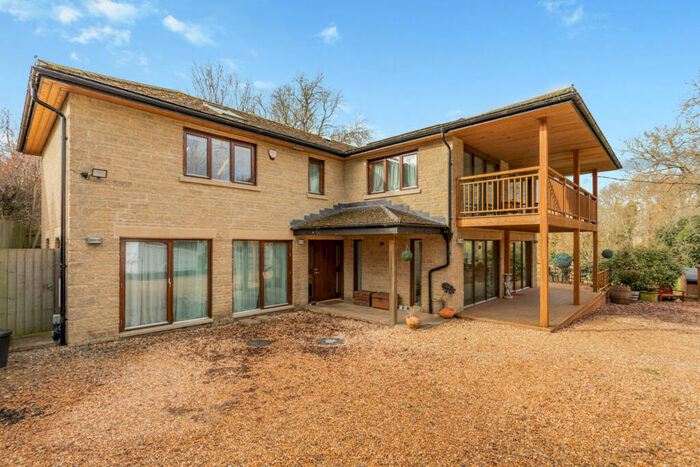
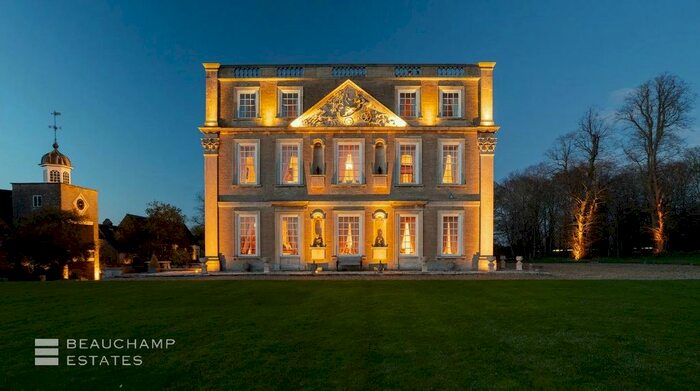
Properties for sale in Harrold


Previously listed properties in Harrold


Roads and Postcodes in Harrold
Navigate through our locations to find the location of your next house in Harrold, Wellingborough for sale or to rent.
| Streets | Postcodes |
|---|---|
| Airfield Road | NN29 7XA |
| Corner Close | NN29 7HT |
| Gold Street | NN29 7HX |
| High Street | NN29 7HS |
| Hinwick Road | NN29 7HU |
| Hornbeam Close | NN29 7HZ |
| Vicarage Lane | NN29 7HR |
| Wollaston Road | NN29 7JE |
| Wymington Road | NN29 7HP |
| NN29 7HJ NN29 7JB NN29 7JF NN29 7JQ |
Transport near Harrold
-
 Wellingborough Station
 -
Bedford Midland Station
-
Bedford St.Johns Station
-
Kettering Station
-
Northampton Station
-
Kempston Hardwick Station
-
Stewartby Station
-
Millbrook (Bedfordshire) Station
-
Lidlington Station
-
Wolverton Station
- FAQ
- Price Paid By Year
- Property Type Price
Frequently asked questions about Harrold
What is the average price for a property for sale in Harrold?
The average price for a property for sale in Harrold is £476,318. There are 26 property listings for sale in Harrold.
What streets have the most expensive properties for sale in Harrold?
The streets with the most expensive properties for sale in Harrold are Vicarage Lane at an average of £707,500 and High Street at an average of £565,750.
What streets have the most affordable properties for sale in Harrold?
The streets with the most affordable properties for sale in Harrold are Corner Close at an average of £316,000 and Gold Street at an average of £369,000.
Which train stations are available in or near Harrold?
Some of the train stations available in or near Harrold are Wellingborough, Bedford Midland and Bedford St.Johns.
Property Price Paid in Harrold by Year
The average sold property price by year was:
| Year | Average Sold Price | Price Change |
Sold Properties
|
|---|---|---|---|
| 2023 | £342,000 | -66% |
1 Property |
| 2022 | £568,250 | 35% |
6 Properties |
| 2021 | £372,000 | 17% |
4 Properties |
| 2020 | £309,666 | -42% |
3 Properties |
| 2019 | £439,250 | -3% |
4 Properties |
| 2018 | £453,333 | -34% |
6 Properties |
| 2017 | £605,500 | 28% |
2 Properties |
| 2016 | £437,000 | 4% |
6 Properties |
| 2015 | £417,583 | 54% |
6 Properties |
| 2014 | £193,425 | -114% |
8 Properties |
| 2013 | £414,375 | 13% |
4 Properties |
| 2012 | £360,750 | 8% |
5 Properties |
| 2011 | £332,666 | 0,1% |
3 Properties |
| 2010 | £332,300 | -55% |
5 Properties |
| 2009 | £514,800 | 18% |
5 Properties |
| 2008 | £423,816 | 25% |
3 Properties |
| 2007 | £316,575 | 28% |
6 Properties |
| 2006 | £229,050 | 11% |
6 Properties |
| 2005 | £202,873 | 8% |
4 Properties |
| 2004 | £186,333 | -16% |
3 Properties |
| 2003 | £215,400 | 16% |
5 Properties |
| 2002 | £181,307 | 20% |
13 Properties |
| 2001 | £144,791 | -31% |
6 Properties |
| 2000 | £189,118 | 8% |
8 Properties |
| 1999 | £174,666 | 26% |
3 Properties |
| 1998 | £128,874 | 21% |
8 Properties |
| 1997 | £102,103 | -4% |
13 Properties |
| 1996 | £106,200 | 3% |
5 Properties |
| 1995 | £103,237 | - |
4 Properties |
Property Price per Property Type in Harrold
Here you can find historic sold price data in order to help with your property search.
The average Property Paid Price for specific property types in the last three years are:
| Property Type | Average Sold Price | Sold Properties |
|---|---|---|
| Semi Detached House | £389,000.00 | 5 Semi Detached Houses |
| Terraced House | £213,500.00 | 2 Terraced Houses |
| Detached House | £716,875.00 | 4 Detached Houses |