
Houses for sale & to rent in Buckingham, Buckinghamshire
House Prices in Buckingham
Properties in Buckingham have an average house price of £412,489.00 and had 1,600 Property Transactions within the last 3 years.¹
Buckingham is an area in Buckinghamshire with 11,781 households², where the most expensive property was sold for £2,700,000.00.
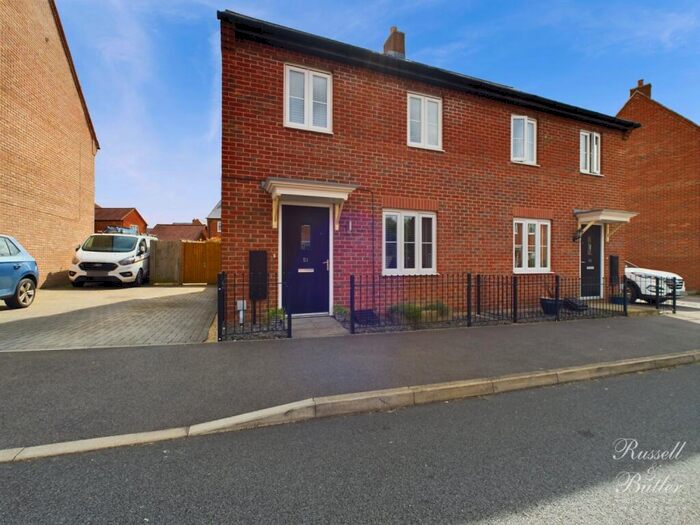
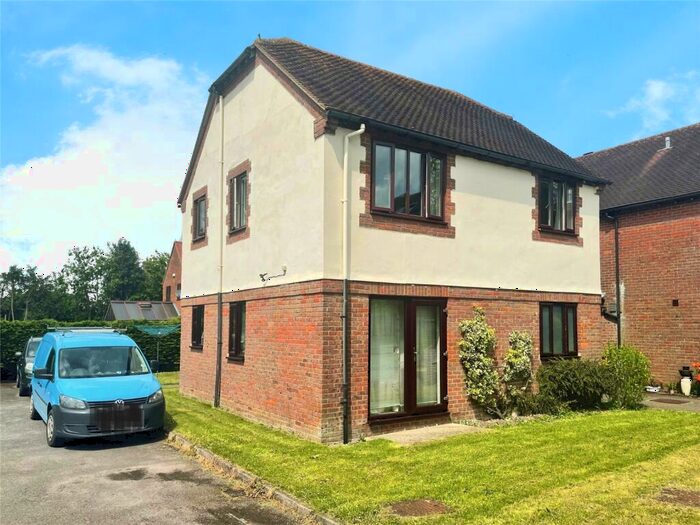
Properties for sale in Buckingham


Neighbourhoods in Buckingham
Navigate through our locations to find the location of your next house in Buckingham, Buckinghamshire for sale or to rent.
Transport in Buckingham
Please see below transportation links in this area:
-
 Milton Keynes Central Station
 -
Wolverton Station
-
Bicester North Station
-
Bletchley Station
-
Bicester Village Station
- FAQ
- Price Paid By Year
- Property Type Price
Frequently asked questions about Buckingham
What is the average price for a property for sale in Buckingham?
The average price for a property for sale in Buckingham is £412,489. This amount is 30% lower than the average price in Buckinghamshire. There are more than 10,000 property listings for sale in Buckingham.
What locations have the most expensive properties for sale in Buckingham?
The locations with the most expensive properties for sale in Buckingham are Stewkley at an average of £706,233, Quainton at an average of £612,000 and Great Horwood at an average of £582,684.
What locations have the most affordable properties for sale in Buckingham?
The locations with the most affordable properties for sale in Buckingham are Buckingham North at an average of £335,682, Buckingham East at an average of £353,654 and Buckingham South at an average of £375,106.
Which train stations are available in or near Buckingham?
Some of the train stations available in or near Buckingham are Milton Keynes Central, Wolverton and Bicester North.
Property Price Paid in Buckingham by Year
The average sold property price by year was:
| Year | Average Sold Price | Price Change |
Sold Properties
|
|---|---|---|---|
| 2024 | £598,250 | 30% |
21 Properties |
| 2023 | £420,246 | -3% |
343 Properties |
| 2022 | £434,487 | 11% |
516 Properties |
| 2021 | £387,611 | 5% |
720 Properties |
| 2020 | £368,040 | 1% |
506 Properties |
| 2019 | £363,418 | -4% |
528 Properties |
| 2018 | £378,014 | 5% |
574 Properties |
| 2017 | £357,938 | 3% |
599 Properties |
| 2016 | £347,546 | 10% |
753 Properties |
| 2015 | £314,050 | 4% |
773 Properties |
| 2014 | £301,477 | 7% |
671 Properties |
| 2013 | £279,196 | 8% |
625 Properties |
| 2012 | £255,739 | -4% |
516 Properties |
| 2011 | £265,912 | -3% |
428 Properties |
| 2010 | £272,947 | 8% |
484 Properties |
| 2009 | £252,465 | -11% |
413 Properties |
| 2008 | £279,710 | 0,1% |
345 Properties |
| 2007 | £279,299 | 11% |
742 Properties |
| 2006 | £247,552 | 4% |
785 Properties |
| 2005 | £238,397 | 4% |
631 Properties |
| 2004 | £229,773 | 13% |
858 Properties |
| 2003 | £200,892 | 8% |
735 Properties |
| 2002 | £185,331 | 14% |
915 Properties |
| 2001 | £159,770 | 13% |
860 Properties |
| 2000 | £139,545 | 11% |
857 Properties |
| 1999 | £124,329 | 16% |
860 Properties |
| 1998 | £104,972 | 9% |
763 Properties |
| 1997 | £95,998 | 6% |
844 Properties |
| 1996 | £89,967 | 5% |
728 Properties |
| 1995 | £85,315 | - |
573 Properties |
Property Price per Property Type in Buckingham
Here you can find historic sold price data in order to help with your property search.
The average Property Paid Price for specific property types in the last three years are:
| Property Type | Average Sold Price | Sold Properties |
|---|---|---|
| Terraced House | £287,945.00 | 423 Terraced Houses |
| Flat | £193,927.00 | 114 Flats |
| Semi Detached House | £354,616.00 | 416 Semi Detached Houses |
| Detached House | £569,634.00 | 647 Detached Houses |