
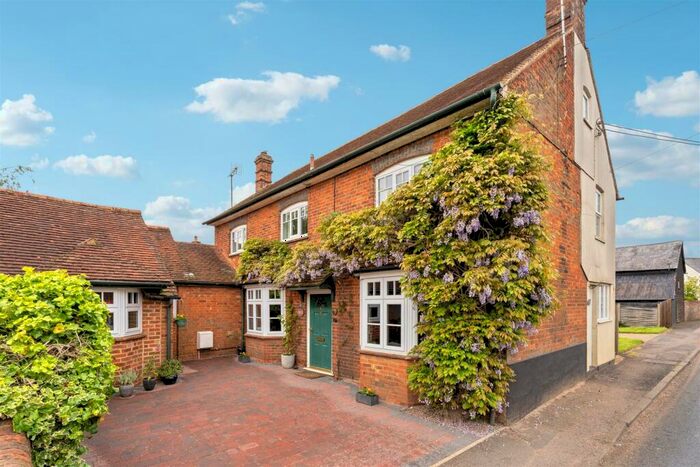
Houses for sale & to rent in Leighton Buzzard, Buckinghamshire
House Prices in Leighton Buzzard
Properties in Leighton Buzzard have an average house price of £493,729.00 and had 684 Property Transactions within the last 3 years.¹
Leighton Buzzard is an area in Buckinghamshire with 4,996 households², where the most expensive property was sold for £2,655,000.00.
Properties for sale in Leighton Buzzard


Neighbourhoods in Leighton Buzzard
Navigate through our locations to find the location of your next house in Leighton Buzzard, Buckinghamshire for sale or to rent.
Transport in Leighton Buzzard
Please see below transportation links in this area:
-
 Cheddington Station
 -
Leighton Buzzard Station
-
Aylesbury Station
-
Tring Station
-
Stoke Mandeville Station
-
Aylesbury Vale Parkway Station
-
Bletchley Station
-
Wendover Station
-
Fenny Stratford Station
-
Bow Brickhill Station
- FAQ
- Price Paid By Year
- Property Type Price
Frequently asked questions about Leighton Buzzard
What is the average price for a property for sale in Leighton Buzzard?
The average price for a property for sale in Leighton Buzzard is £493,729. This amount is 12% lower than the average price in Buckinghamshire. There are more than 10,000 property listings for sale in Leighton Buzzard.
What locations have the most expensive properties for sale in Leighton Buzzard?
The locations with the most expensive properties for sale in Leighton Buzzard are Wingrave at an average of £686,143, Great Brickhill at an average of £643,704 and Edlesborough at an average of £631,458.
What locations have the most affordable properties for sale in Leighton Buzzard?
The locations with the most affordable properties for sale in Leighton Buzzard are Cheddington at an average of £438,481, Wing at an average of £459,369 and Pitstone at an average of £466,077.
Which train stations are available in or near Leighton Buzzard?
Some of the train stations available in or near Leighton Buzzard are Cheddington, Leighton Buzzard and Aylesbury.
Property Price Paid in Leighton Buzzard by Year
The average sold property price by year was:
| Year | Average Sold Price | Price Change |
Sold Properties
|
|---|---|---|---|
| 2024 | £513,343 | 4% |
16 Properties |
| 2023 | £492,870 | -5% |
119 Properties |
| 2022 | £518,863 | 8% |
223 Properties |
| 2021 | £475,886 | 7% |
326 Properties |
| 2020 | £444,165 | 2% |
242 Properties |
| 2019 | £436,895 | 2% |
198 Properties |
| 2018 | £426,097 | 2% |
223 Properties |
| 2017 | £417,194 | 1% |
263 Properties |
| 2016 | £414,214 | 12% |
239 Properties |
| 2015 | £362,912 | 7% |
274 Properties |
| 2014 | £339,173 | 9% |
284 Properties |
| 2013 | £310,127 | -4% |
229 Properties |
| 2012 | £322,590 | 10% |
157 Properties |
| 2011 | £289,665 | -8% |
209 Properties |
| 2010 | £312,249 | 12% |
187 Properties |
| 2009 | £275,453 | -7% |
152 Properties |
| 2008 | £295,284 | -8% |
123 Properties |
| 2007 | £320,343 | 9% |
284 Properties |
| 2006 | £292,101 | 6% |
341 Properties |
| 2005 | £274,217 | 3% |
245 Properties |
| 2004 | £267,205 | 9% |
277 Properties |
| 2003 | £242,943 | 15% |
314 Properties |
| 2002 | £207,693 | 18% |
363 Properties |
| 2001 | £171,217 | 6% |
325 Properties |
| 2000 | £161,029 | 6% |
306 Properties |
| 1999 | £151,204 | 15% |
336 Properties |
| 1998 | £128,334 | 3% |
260 Properties |
| 1997 | £124,304 | 18% |
278 Properties |
| 1996 | £101,827 | 11% |
305 Properties |
| 1995 | £90,449 | - |
212 Properties |
Property Price per Property Type in Leighton Buzzard
Here you can find historic sold price data in order to help with your property search.
The average Property Paid Price for specific property types in the last three years are:
| Property Type | Average Sold Price | Sold Properties |
|---|---|---|
| Semi Detached House | £413,250.00 | 209 Semi Detached Houses |
| Terraced House | £362,772.00 | 169 Terraced Houses |
| Detached House | £643,880.00 | 287 Detached Houses |
| Flat | £275,737.00 | 19 Flats |