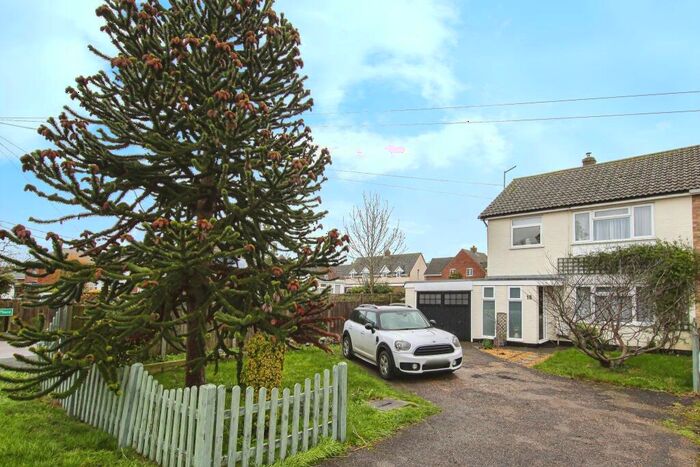
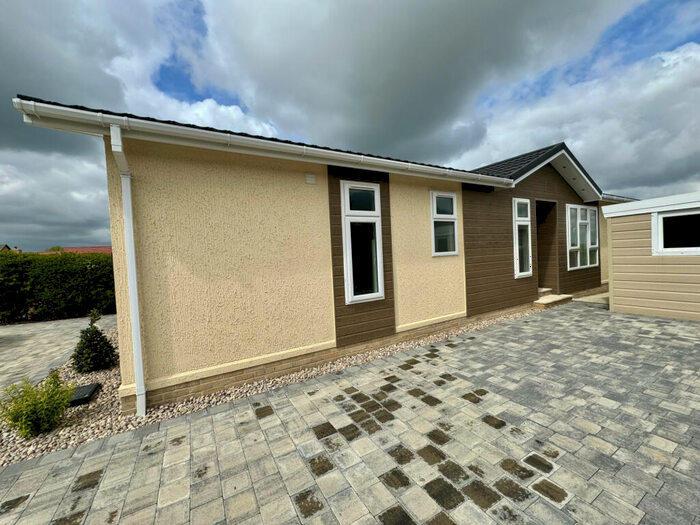
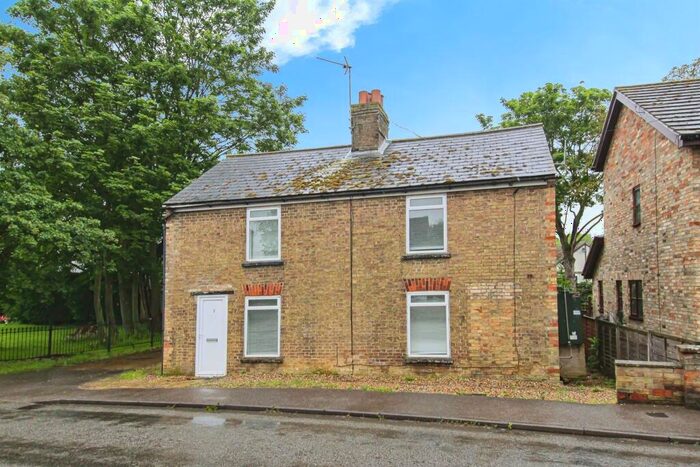
Houses for sale & to rent in Haddenham, Ely
House Prices in Haddenham
Properties in Haddenham have an average house price of £351,377.00 and had 254 Property Transactions within the last 3 years¹.
Haddenham is an area in Ely, Cambridgeshire with 2,326 households², where the most expensive property was sold for £845,500.00.
Properties for sale in Haddenham
Roads and Postcodes in Haddenham
Navigate through our locations to find the location of your next house in Haddenham, Ely for sale or to rent.
| Streets | Postcodes |
|---|---|
| Aldreth Road | CB6 3PN CB6 3PP CB6 3PW CB6 3UB |
| Ashleaf Close | CB6 3GZ |
| Barton Close | CB6 2HS |
| Bell Gardens | CB6 3TX CB6 3TZ |
| Briars End | CB6 2GA CB6 2GB |
| Briery Fields | CB6 2JP |
| Broad Way | CB6 2HJ |
| Bury Lane | CB6 3PR |
| Camping Close | CB6 3UA |
| Cherry Orchard | CB6 3UF |
| Chestnut Close | CB6 3QW |
| Chewells Close | CB6 3XE |
| Chewells Lane | CB6 3SS |
| Church Farm Close | CB6 3QL |
| Church Lane | CB6 3TB |
| Church Road | CB6 3QE |
| Church View | CB6 2HH |
| Clover End | CB6 2XD |
| Cole Close | CB6 2JX |
| Common Road | CB6 2HY |
| Cracknell Drove | CB6 3PD |
| Crossways | CB6 3TP |
| Duck Lane | CB6 3UE |
| Elizabeth Way | CB6 3SF |
| Elm Close | CB6 2JH |
| Ely Road | CB6 2AA |
| Field End | CB6 2XE |
| Froize End | CB6 3UQ |
| Glebe Way | CB6 3TG |
| Granary End | CB6 2XF |
| Granta Close | CB6 2HR |
| Great Mill View | CB6 3RF |
| Green Lane | CB6 3GT |
| Hardwicke Fields | CB6 3TW |
| Hereward Close | CB6 3NZ |
| High Street | CB6 3PG CB6 3PQ CB6 3XA CB6 3XB |
| Hillrow | CB6 3TH CB6 3TJ CB6 3TL CB6 3TQ |
| Hillrow Causeway | CB6 3PA CB6 3PB |
| Hinton Hall Lane | CB6 3SZ |
| Hinton View | CB6 3SP |
| Hod Hall Lane | CB6 3UX |
| Hoghill Drove | CB6 3FU |
| Hop Row | CB6 3SR |
| Laurel Drive | CB6 3FZ |
| Lester Drive | CB6 3UW |
| Linden Close | CB6 3UN |
| Linden End | CB6 3UD |
| Linden Way | CB6 3UG |
| Lion Court | CB6 3XL |
| Lode Way | CB6 3UL |
| Lodge Gardens | CB6 3TR |
| Long Drove | CB6 3TU |
| Main Street | CB6 2HG CB6 2HP CB6 2HQ CB6 2HT CB6 3QG |
| Mallard Rise | CB6 3TY |
| Manor Close | CB6 2JB |
| Manor Court Road | CB6 2JW |
| Manor Road | CB6 2JA |
| Marroway Lane | CB6 2HU |
| Meadow Close | CB6 2JD |
| Meadow Lane | CB6 3TS |
| Meadowbrook | CB6 3UZ |
| Metcalfe Way | CB6 3UP |
| Midfeather Villas | PE28 3PR |
| Mill Yard | CB6 3TT |
| Nelsons Lane | CB6 3UH |
| New Road | CB6 3SY |
| Newtown Road | CB6 3TF |
| Northumbria Close | CB6 3HT |
| Orchard Way | CB6 3UT |
| Orton Drive | CB6 2JG |
| Ovins Rise | CB6 3LH |
| Paddock Way | CB6 3TN |
| Pear Tree Close | CB6 3UU |
| Perry Close | CB6 3SU |
| Rowan Close | CB6 3QF |
| Sand Lane | CB6 3PH |
| School Lane | CB6 3PL |
| Station Road | CB6 3XD |
| Sutton Road | CB6 2HX CB6 3PS CB6 3PT |
| The Borough | CB6 3PJ |
| The Green | CB6 3TA |
| The Pond | CB6 3XG |
| The Rampart | CB6 3ST |
| The Rick Yard | CB6 3UR |
| The Warren | CB6 2HN |
| Victoria Green | CB6 2XB |
| Walnut Drive | CB6 3QU |
| Ward Way | CB6 2JR |
| West End | CB6 3TD CB6 3TE |
| West End Close | CB6 2HA |
| Wheats Close | CB6 2JQ |
| Wilburton Road | CB6 3SX |
| CB6 3PE CB6 3PF |
Transport near Haddenham
- FAQ
- Price Paid By Year
- Property Type Price
Frequently asked questions about Haddenham
What is the average price for a property for sale in Haddenham?
The average price for a property for sale in Haddenham is £351,377. This amount is 4% higher than the average price in Ely. There are 993 property listings for sale in Haddenham.
What streets have the most expensive properties for sale in Haddenham?
The streets with the most expensive properties for sale in Haddenham are Hinton Hall Lane at an average of £610,000, Hillrow at an average of £590,500 and Hillrow Causeway at an average of £555,000.
What streets have the most affordable properties for sale in Haddenham?
The streets with the most affordable properties for sale in Haddenham are Northumbria Close at an average of £135,000, Lester Drive at an average of £180,625 and Bell Gardens at an average of £193,833.
Which train stations are available in or near Haddenham?
Some of the train stations available in or near Haddenham are Ely, Waterbeach and Manea.
Property Price Paid in Haddenham by Year
The average sold property price by year was:
| Year | Average Sold Price | Price Change |
Sold Properties
|
|---|---|---|---|
| 2024 | £310,000 | -22% |
4 Properties |
| 2023 | £379,669 | 10% |
56 Properties |
| 2022 | £342,396 | -1% |
78 Properties |
| 2021 | £345,186 | 5% |
116 Properties |
| 2020 | £327,104 | 1% |
62 Properties |
| 2019 | £322,373 | 5% |
76 Properties |
| 2018 | £307,749 | -4% |
97 Properties |
| 2017 | £320,345 | 1% |
96 Properties |
| 2016 | £318,403 | 19% |
90 Properties |
| 2015 | £257,735 | 3% |
96 Properties |
| 2014 | £250,274 | 12% |
82 Properties |
| 2013 | £219,083 | -0,1% |
89 Properties |
| 2012 | £219,256 | 3% |
81 Properties |
| 2011 | £213,757 | 0,1% |
74 Properties |
| 2010 | £213,492 | 10% |
92 Properties |
| 2009 | £191,227 | -6% |
77 Properties |
| 2008 | £201,884 | -6% |
69 Properties |
| 2007 | £214,932 | 2% |
115 Properties |
| 2006 | £210,366 | 9% |
155 Properties |
| 2005 | £191,833 | 5% |
124 Properties |
| 2004 | £181,795 | 9% |
124 Properties |
| 2003 | £164,589 | 12% |
176 Properties |
| 2002 | £145,225 | 15% |
151 Properties |
| 2001 | £122,922 | 14% |
148 Properties |
| 2000 | £106,293 | 19% |
140 Properties |
| 1999 | £86,554 | -2% |
188 Properties |
| 1998 | £88,148 | 13% |
152 Properties |
| 1997 | £76,277 | 1% |
205 Properties |
| 1996 | £75,166 | -5% |
118 Properties |
| 1995 | £79,042 | - |
112 Properties |
Property Price per Property Type in Haddenham
Here you can find historic sold price data in order to help with your property search.
The average Property Paid Price for specific property types in the last three years are:
| Property Type | Average Sold Price | Sold Properties |
|---|---|---|
| Semi Detached House | £300,658.00 | 80 Semi Detached Houses |
| Detached House | £434,652.00 | 118 Detached Houses |
| Terraced House | £258,667.00 | 50 Terraced Houses |
| Flat | £162,491.00 | 6 Flats |


