Houses for sale & to rent in Wybunbury, Crewe
House Prices in Wybunbury
Properties in Wybunbury have an average house price of £404,140.00 and had 208 Property Transactions within the last 3 years¹.
Wybunbury is an area in Crewe, Cheshire with 1,027 households², where the most expensive property was sold for £920,000.00.
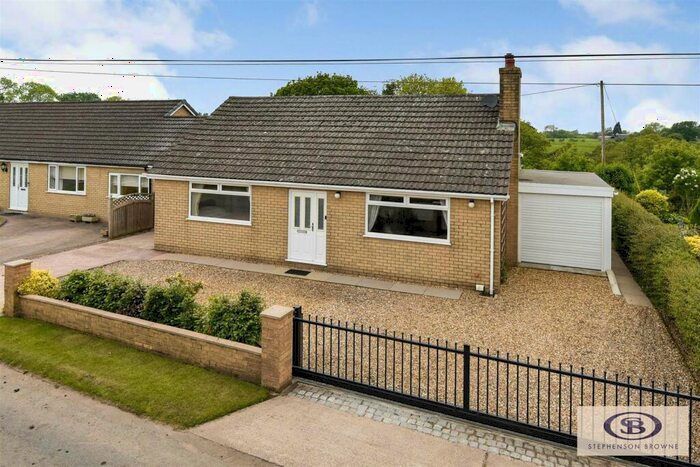
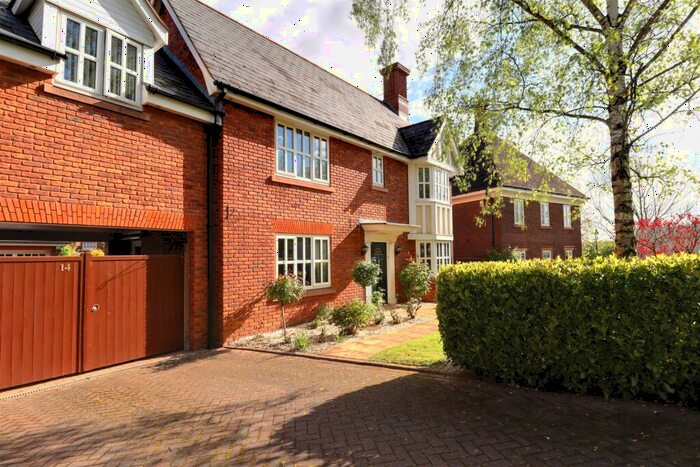
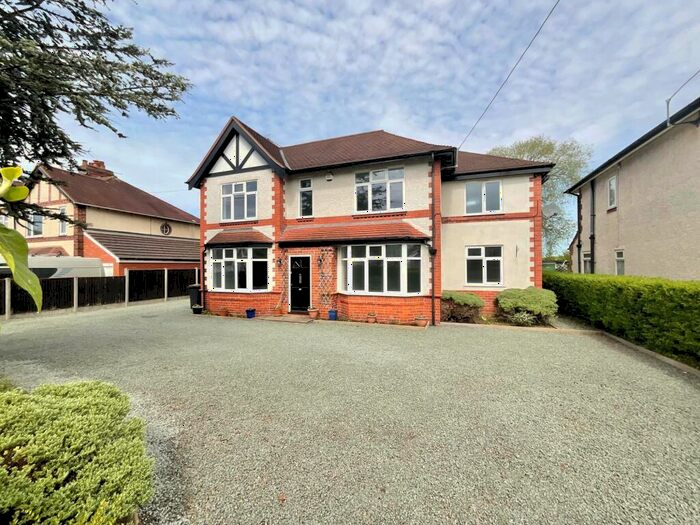
Properties for sale in Wybunbury
Roads and Postcodes in Wybunbury
Navigate through our locations to find the location of your next house in Wybunbury, Crewe for sale or to rent.
| Streets | Postcodes |
|---|---|
| Abbey Park Way | CW2 5NR CW2 5TD |
| Abbeydale Close | CW2 5RR |
| Aldford Close | CW2 5JX |
| Ashbourne Drive | CW2 5FY |
| Asphodel Road | CW2 5XU |
| Bickley Close | CW2 5JY |
| Birch Lane | CW2 5RH |
| Brackenwood Mews | CW2 5GQ |
| Brampton Close | CW2 5NP |
| Buck Lane | CW2 5JP |
| Buckthorn Place | CW2 5XW |
| Burmese Avenue | CW2 5RL |
| Burnet Close | CW2 5TY |
| Chadwell Court | CW2 5FF |
| Chalfont Crescent | CW2 5QT |
| Checkley Lane | CW3 9DB CW3 9DD |
| Chesterton Way | CW2 5NZ |
| Chidlow Close | CW2 5RE |
| Chiltern Close | CW2 5GE |
| Chorlton Lane | CW2 5NF CW2 5RS |
| Churton Close | CW2 5RA |
| Cobbs Lane | CW2 5JL CW2 5JN CW2 5JJ |
| Cranberry Drive | CW2 5XY |
| Deansgate | CW2 5SL |
| Delamere Close | CW2 5SJ |
| Den Lane | CW3 9BX |
| Edenbridge Close | CW2 5QU |
| Elder Road | CW2 5XS |
| Ellwood Green | CW2 5RJ |
| Fairhaven | CW2 5GG |
| Ferndown Way | CW2 5GS |
| Freshwater Drive | CW2 5GR |
| Golden Hill | CW2 5SG |
| Gorsty Hill Close | CW2 5QS |
| Grange Close | CW2 5FL |
| Hadley Drive | CW2 5FP |
| Hampstead Drive | CW2 5GT |
| Haverhill Close | CW2 5RP |
| Heaton Way | CW2 5FJ |
| Henley Road | CW2 5GD |
| Hillside Close | CW2 5FZ |
| Jack Mills Way | CW2 5RX |
| Kendal Way | CW2 5SA |
| Kings Meadow | CW2 5GZ |
| Kingsdown Close | CW2 5FX |
| Kingswood Avenue | CW2 5QY |
| Little Lakes | CW2 5GX |
| Marshfern Place | CW2 5TT |
| Marton Close | CW2 5RD |
| Maureen Campbell Drive | CW2 5BF |
| Newcastle Road | CW2 5JG CW2 5JS CW2 5JT CW2 5NQ CW2 5JR CW2 5NG CW2 5PX |
| Norbury Close | CW2 5LA |
| Oakdale Close | CW2 5QX |
| Oaklands Court | CW2 5SN |
| Parklands Drive | CW2 5FH |
| Pastures Drive | CW2 5SD |
| Petersfield Way | CW2 5SH |
| Pit Lane | CW2 5JH CW2 5JQ |
| Redbourne Drive | CW2 5GH |
| Richmond Close | CW2 5GN |
| Ridley Close | CW2 5LB |
| Rushton Drive | CW2 5RG |
| Ryburn Close | CW2 5RN |
| Sandford Crescent | CW2 5GJ |
| Sherbourne Court | CW2 5SQ |
| Silverdale Close | CW2 5GW |
| Springwater Drive | CW2 5FW |
| St Andrews Close | CW2 5TL |
| St Andrews Mews | CW2 5BQ |
| St Augustines Drive | CW2 5FE |
| St Clements Court | CW2 5NS |
| St Davids Mews | CW2 5RW |
| St Georges Court | CW2 5SP |
| Stock Lane | CW2 5ED |
| Sundew Road | CW2 5TX |
| Tamwell Road | CW2 5TU |
| The Brooklands | CW2 5HY |
| Tilstone Close | CW2 5RQ |
| Two Saints Place | CW2 5RZ |
| Walnut Close | CW2 5DG |
| Waverton Close | CW2 5RB |
| Waybutt Lane | CW2 5QA |
| Westgate Park | CW2 5GY |
| Westwood Close | CW2 5GF |
| Winchester Court | CW2 5FG |
| Woodcott Close | CW2 5JZ |
| Woodlands Drive | CW2 5GU |
| Woolston Drive | CW2 5RF |
| Wychwood Park | CW2 5GP |
| CW2 5TW |
Transport near Wybunbury
-
Crewe Station
-
Nantwich Station
-
Alsager Station
-
Sandbach Station
-
Kidsgrove Station
-
Longport Station
-
Wrenbury Station
-
Stoke-On-Trent Station
- FAQ
- Price Paid By Year
- Property Type Price
Frequently asked questions about Wybunbury
What is the average price for a property for sale in Wybunbury?
The average price for a property for sale in Wybunbury is £404,140. This amount is 55% higher than the average price in Crewe. There are 860 property listings for sale in Wybunbury.
What streets have the most expensive properties for sale in Wybunbury?
The streets with the most expensive properties for sale in Wybunbury are Ferndown Way at an average of £774,333, Kingsdown Close at an average of £768,000 and Freshwater Drive at an average of £735,109.
What streets have the most affordable properties for sale in Wybunbury?
The streets with the most affordable properties for sale in Wybunbury are Sherbourne Court at an average of £123,750, Chidlow Close at an average of £174,000 and Golden Hill at an average of £185,800.
Which train stations are available in or near Wybunbury?
Some of the train stations available in or near Wybunbury are Crewe, Nantwich and Alsager.
Property Price Paid in Wybunbury by Year
The average sold property price by year was:
| Year | Average Sold Price | Price Change |
Sold Properties
|
|---|---|---|---|
| 2024 | £211,666 | -82% |
3 Properties |
| 2023 | £385,341 | -6% |
41 Properties |
| 2022 | £406,682 | -3% |
76 Properties |
| 2021 | £417,266 | 11% |
88 Properties |
| 2020 | £369,426 | 22% |
54 Properties |
| 2019 | £286,374 | 5% |
73 Properties |
| 2018 | £271,944 | -27% |
94 Properties |
| 2017 | £344,567 | -2% |
67 Properties |
| 2016 | £350,684 | 14% |
65 Properties |
| 2015 | £300,143 | 8% |
65 Properties |
| 2014 | £276,642 | -10% |
78 Properties |
| 2013 | £305,548 | 8% |
61 Properties |
| 2012 | £282,400 | -2% |
37 Properties |
| 2011 | £289,029 | -16% |
47 Properties |
| 2010 | £336,445 | 8% |
56 Properties |
| 2009 | £310,682 | 6% |
58 Properties |
| 2008 | £292,143 | -22% |
53 Properties |
| 2007 | £357,139 | 12% |
114 Properties |
| 2006 | £312,721 | -2% |
124 Properties |
| 2005 | £320,047 | -31% |
94 Properties |
| 2004 | £419,710 | 8% |
128 Properties |
| 2003 | £385,251 | 23% |
94 Properties |
| 2002 | £295,397 | 16% |
94 Properties |
| 2001 | £248,930 | 36% |
75 Properties |
| 2000 | £158,359 | 17% |
46 Properties |
| 1999 | £131,071 | 29% |
48 Properties |
| 1998 | £93,037 | 14% |
20 Properties |
| 1997 | £80,053 | 26% |
19 Properties |
| 1996 | £59,511 | 3% |
13 Properties |
| 1995 | £58,021 | - |
15 Properties |
Property Price per Property Type in Wybunbury
Here you can find historic sold price data in order to help with your property search.
The average Property Paid Price for specific property types in the last three years are:
| Property Type | Average Sold Price | Sold Properties |
|---|---|---|
| Semi Detached House | £241,899.00 | 31 Semi Detached Houses |
| Detached House | £504,722.00 | 134 Detached Houses |
| Terraced House | £191,628.00 | 28 Terraced Houses |
| Flat | £237,600.00 | 15 Flats |


