
Houses for sale & to rent in Neston, Cheshire
House Prices in Neston
Properties in Neston have an average house price of £361,808.00 and had 885 Property Transactions within the last 3 years.¹
Neston is an area in Cheshire with 8,362 households², where the most expensive property was sold for £2,925,000.00.
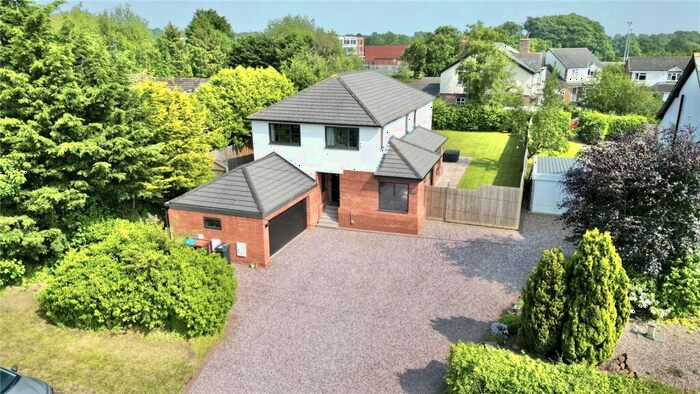
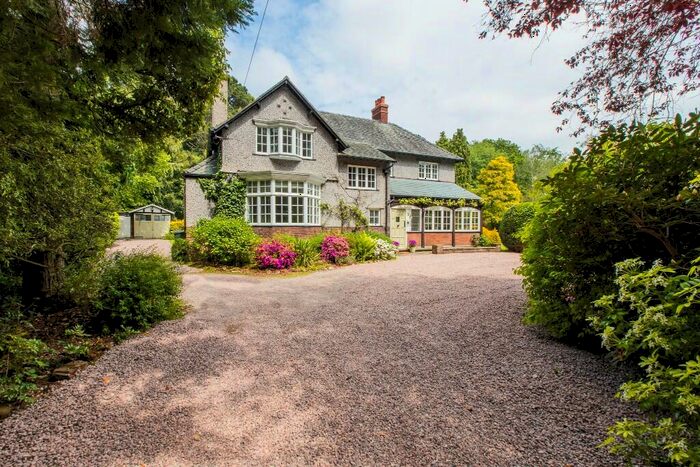
Properties for sale in Neston


Neighbourhoods in Neston
Navigate through our locations to find the location of your next house in Neston, Cheshire for sale or to rent.
Transport in Neston
Please see below transportation links in this area:
-
 Neston Station
 -
Hooton Station
-
Heswall Station
-
Eastham Rake Station
-
Bromborough Station
-
Bromborough Rake Station
-
Spital Station
-
Little Sutton Station
-
Flint Station
-
Port Sunlight Station
- FAQ
- Price Paid By Year
- Property Type Price
Frequently asked questions about Neston
What is the average price for a property for sale in Neston?
The average price for a property for sale in Neston is £361,808. This amount is 16% higher than the average price in Cheshire. There are 1,460 property listings for sale in Neston.
What locations have the most expensive properties for sale in Neston?
The locations with the most expensive properties for sale in Neston are Saughall & Mollington at an average of £630,000, Willaston & Thornton at an average of £605,904 and Willaston And Thornton at an average of £467,169.
What locations have the most affordable properties for sale in Neston?
The locations with the most affordable properties for sale in Neston are Neston at an average of £246,549, Little Neston And Burton at an average of £336,031 and Parkgate at an average of £412,041.
Which train stations are available in or near Neston?
Some of the train stations available in or near Neston are Neston, Hooton and Heswall.
Property Price Paid in Neston by Year
The average sold property price by year was:
| Year | Average Sold Price | Price Change |
Sold Properties
|
|---|---|---|---|
| 2024 | £350,071 | -6% |
14 Properties |
| 2023 | £372,648 | 3% |
198 Properties |
| 2022 | £362,794 | 2% |
269 Properties |
| 2021 | £356,244 | 14% |
404 Properties |
| 2020 | £306,041 | 4% |
299 Properties |
| 2019 | £292,751 | 3% |
355 Properties |
| 2018 | £284,611 | 13% |
314 Properties |
| 2017 | £248,874 | -1% |
344 Properties |
| 2016 | £252,420 | 2% |
360 Properties |
| 2015 | £246,269 | -1% |
420 Properties |
| 2014 | £248,377 | 6% |
351 Properties |
| 2013 | £232,258 | 0,4% |
265 Properties |
| 2012 | £231,336 | -6% |
197 Properties |
| 2011 | £245,123 | 10% |
202 Properties |
| 2010 | £220,608 | -5% |
183 Properties |
| 2009 | £230,929 | -7% |
209 Properties |
| 2008 | £246,047 | 3% |
211 Properties |
| 2007 | £239,872 | 9% |
360 Properties |
| 2006 | £219,144 | 4% |
380 Properties |
| 2005 | £210,925 | -1% |
349 Properties |
| 2004 | £212,990 | 7% |
466 Properties |
| 2003 | £197,747 | 27% |
351 Properties |
| 2002 | £144,661 | 11% |
405 Properties |
| 2001 | £129,322 | 12% |
414 Properties |
| 2000 | £113,412 | 9% |
406 Properties |
| 1999 | £103,152 | 15% |
371 Properties |
| 1998 | £87,224 | 3% |
310 Properties |
| 1997 | £84,937 | -5% |
391 Properties |
| 1996 | £89,035 | 10% |
291 Properties |
| 1995 | £80,370 | - |
280 Properties |
Property Price per Property Type in Neston
Here you can find historic sold price data in order to help with your property search.
The average Property Paid Price for specific property types in the last three years are:
| Property Type | Average Sold Price | Sold Properties |
|---|---|---|
| Semi Detached House | £294,769.00 | 263 Semi Detached Houses |
| Terraced House | £233,589.00 | 166 Terraced Houses |
| Detached House | £500,716.00 | 386 Detached Houses |
| Flat | £151,762.00 | 70 Flats |