
Houses for sale & to rent in Vincent Square, London
House Prices in Vincent Square
Properties in this part of Vincent Square within London have an average house price of £961,778.00 and had 393 Property Transactions within the last 3 years¹. This area has 5,076 households² , where the most expensive property was sold for £8,700,000.00.
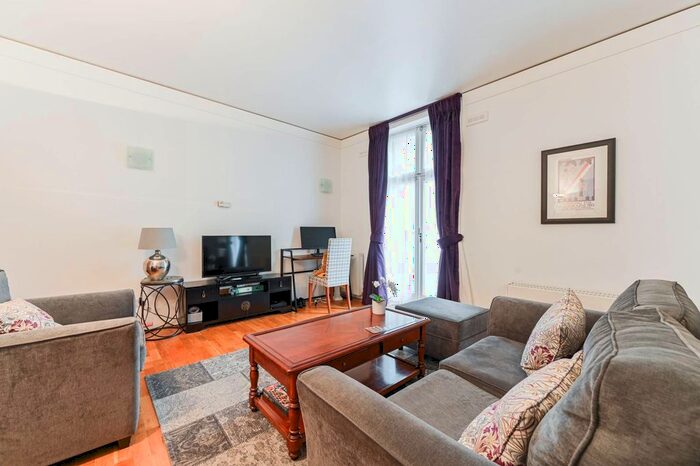
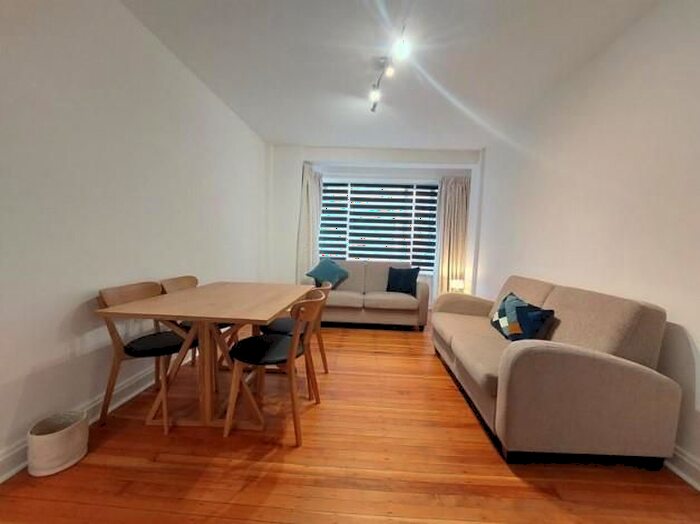
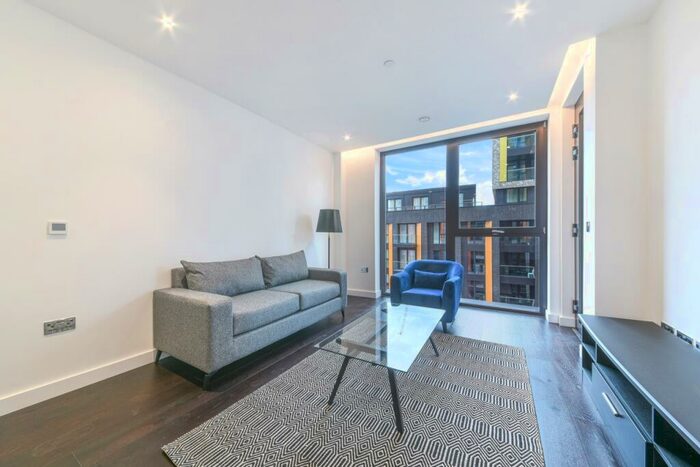
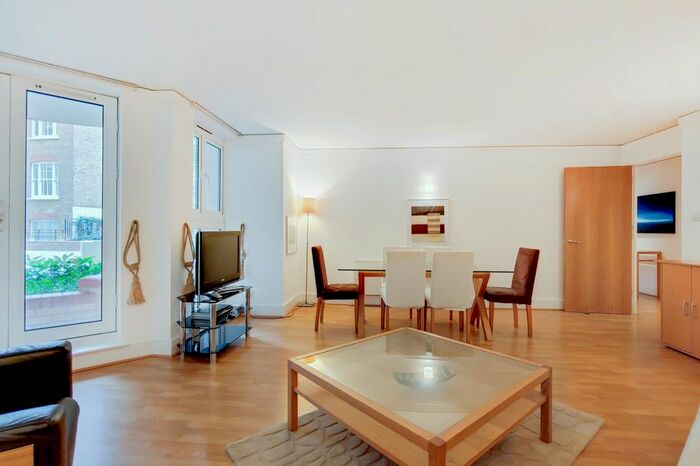
Properties for sale in Vincent Square


Roads and Postcodes in Vincent Square
Navigate through our locations to find the location of your next house in Vincent Square, London for sale or to rent.
Transport near Vincent Square
-
 Pimlico Station
 -
St. James's Park Station
-
 Victoria Station
 -
Westminster Station
-
Vauxhall Station
-
Nine Elms Station
-
Sloane Square Station
-
Green Park Station
-
Hyde Park Corner Station
-
Battersea Power Station Station
- FAQ
- Price Paid By Year
- Property Type Price
Frequently asked questions about Vincent Square
What is the average price for a property for sale in Vincent Square?
The average price for a property for sale in Vincent Square is £961,778. This amount is 59% lower than the average price in London. There are 9,848 property listings for sale in Vincent Square.
What streets have the most expensive properties for sale in Vincent Square?
The streets with the most expensive properties for sale in Vincent Square are Ponsonby Terrace at an average of £1,882,500, Millbank at an average of £1,517,099 and Artillery Row at an average of £1,508,333.
What streets have the most affordable properties for sale in Vincent Square?
The streets with the most affordable properties for sale in Vincent Square are Vane Street at an average of £183,750, Peabody Estate at an average of £381,250 and Vincent Street at an average of £440,625.
Which train stations are available in or near Vincent Square?
Some of the train stations available in or near Vincent Square are Victoria and Vauxhall.
Which tube stations are available in or near Vincent Square?
Some of the tube stations available in or near Vincent Square are Pimlico, St. James's Park and Victoria.
Property Price Paid in Vincent Square by Year
The average sold property price by year was:
| Year | Average Sold Price | Price Change |
Sold Properties
|
|---|---|---|---|
| 2024 | £522,500 | -100% |
4 Properties |
| 2023 | £1,043,709 | 6% |
130 Properties |
| 2022 | £976,558 | 9% |
118 Properties |
| 2021 | £886,332 | -3% |
141 Properties |
| 2020 | £916,859 | -24% |
72 Properties |
| 2019 | £1,141,427 | -66% |
125 Properties |
| 2018 | £1,891,501 | 29% |
100 Properties |
| 2017 | £1,351,992 | -31% |
182 Properties |
| 2016 | £1,771,875 | 29% |
354 Properties |
| 2015 | £1,254,458 | 17% |
222 Properties |
| 2014 | £1,037,100 | 15% |
172 Properties |
| 2013 | £878,137 | 14% |
169 Properties |
| 2012 | £758,133 | 7% |
139 Properties |
| 2011 | £704,117 | 11% |
167 Properties |
| 2010 | £624,984 | 12% |
204 Properties |
| 2009 | £550,296 | -13% |
138 Properties |
| 2008 | £619,158 | 9% |
167 Properties |
| 2007 | £561,353 | 18% |
260 Properties |
| 2006 | £459,245 | 5% |
306 Properties |
| 2005 | £436,693 | 18% |
381 Properties |
| 2004 | £358,622 | -11% |
236 Properties |
| 2003 | £399,036 | 0,4% |
310 Properties |
| 2002 | £397,458 | 12% |
212 Properties |
| 2001 | £348,566 | 13% |
177 Properties |
| 2000 | £303,133 | 5% |
291 Properties |
| 1999 | £288,211 | 20% |
406 Properties |
| 1998 | £231,960 | 18% |
239 Properties |
| 1997 | £191,247 | 16% |
293 Properties |
| 1996 | £161,226 | 4% |
190 Properties |
| 1995 | £155,547 | - |
107 Properties |
Property Price per Property Type in Vincent Square
Here you can find historic sold price data in order to help with your property search.
The average Property Paid Price for specific property types in the last three years are:
| Property Type | Average Sold Price | Sold Properties |
|---|---|---|
| Flat | £937,445.00 | 385 Flats |
| Terraced House | £2,132,812.00 | 8 Terraced Houses |