
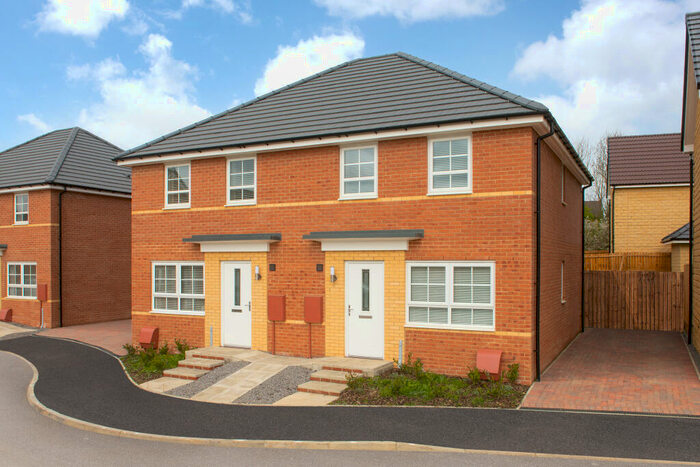
Houses for sale & to rent in Ferryhill, County Durham
House Prices in Ferryhill
Properties in Ferryhill have an average house price of £91,463.00 and had 1,406 Property Transactions within the last 3 years.¹
Ferryhill is an area in County Durham with 8,065 households², where the most expensive property was sold for £910,000.00.
Properties for sale in Ferryhill


Neighbourhoods in Ferryhill
Navigate through our locations to find the location of your next house in Ferryhill, County Durham for sale or to rent.
Transport in Ferryhill
Please see below transportation links in this area:
-
 Newton Aycliffe Station
 -
Shildon Station
-
Bishop Auckland Station
-
Heighington Station
-
Durham Station
-
North Road Station
- FAQ
- Price Paid By Year
- Property Type Price
Frequently asked questions about Ferryhill
What is the average price for a property for sale in Ferryhill?
The average price for a property for sale in Ferryhill is £91,463. This amount is 41% lower than the average price in County Durham. There are 3,361 property listings for sale in Ferryhill.
What locations have the most expensive properties for sale in Ferryhill?
The locations with the most expensive properties for sale in Ferryhill are Sedgefield at an average of £549,950, Aycliffe North And Middridge at an average of £357,625 and Chilton at an average of £123,186.
What locations have the most affordable properties for sale in Ferryhill?
The locations with the most affordable properties for sale in Ferryhill are Ferryhill at an average of £69,755 and Bishop Middleham And Cornforth at an average of £109,944.
Which train stations are available in or near Ferryhill?
Some of the train stations available in or near Ferryhill are Newton Aycliffe, Shildon and Bishop Auckland.
Property Price Paid in Ferryhill by Year
The average sold property price by year was:
| Year | Average Sold Price | Price Change |
Sold Properties
|
|---|---|---|---|
| 2024 | £74,404 | -13% |
43 Properties |
| 2023 | £84,339 | -12% |
364 Properties |
| 2022 | £94,531 | -1% |
471 Properties |
| 2021 | £95,027 | 15% |
528 Properties |
| 2020 | £81,166 | -18% |
430 Properties |
| 2019 | £95,595 | 2% |
393 Properties |
| 2018 | £93,225 | 21% |
413 Properties |
| 2017 | £74,083 | -10% |
346 Properties |
| 2016 | £81,225 | -10% |
322 Properties |
| 2015 | £89,076 | 7% |
295 Properties |
| 2014 | £82,819 | -7% |
312 Properties |
| 2013 | £88,574 | 10% |
223 Properties |
| 2012 | £79,292 | -11% |
147 Properties |
| 2011 | £87,966 | -3% |
193 Properties |
| 2010 | £90,463 | -1% |
148 Properties |
| 2009 | £91,744 | 0,1% |
153 Properties |
| 2008 | £91,687 | 5% |
256 Properties |
| 2007 | £86,942 | 9% |
560 Properties |
| 2006 | £78,820 | 11% |
493 Properties |
| 2005 | £70,477 | 23% |
450 Properties |
| 2004 | £54,192 | 5% |
557 Properties |
| 2003 | £51,474 | 15% |
659 Properties |
| 2002 | £43,595 | 14% |
548 Properties |
| 2001 | £37,606 | 3% |
351 Properties |
| 2000 | £36,601 | -3% |
303 Properties |
| 1999 | £37,831 | 10% |
211 Properties |
| 1998 | £34,168 | -1% |
250 Properties |
| 1997 | £34,391 | 12% |
224 Properties |
| 1996 | £30,275 | -9% |
236 Properties |
| 1995 | £32,909 | - |
247 Properties |
Property Price per Property Type in Ferryhill
Here you can find historic sold price data in order to help with your property search.
The average Property Paid Price for specific property types in the last three years are:
| Property Type | Average Sold Price | Sold Properties |
|---|---|---|
| Semi Detached House | £103,573.00 | 324 Semi Detached Houses |
| Terraced House | £58,487.00 | 900 Terraced Houses |
| Detached House | £239,486.00 | 176 Detached Houses |
| Flat | £42,000.00 | 6 Flats |