
Houses for sale & to rent in Newcastle Upon Tyne, Gateshead
House Prices in Newcastle Upon Tyne
Properties in Newcastle Upon Tyne have an average house price of £201,394.00 and had 1,164 Property Transactions within the last 3 years.¹
Newcastle Upon Tyne is an area in Gateshead with 10,664 households², where the most expensive property was sold for £1,190,000.00.
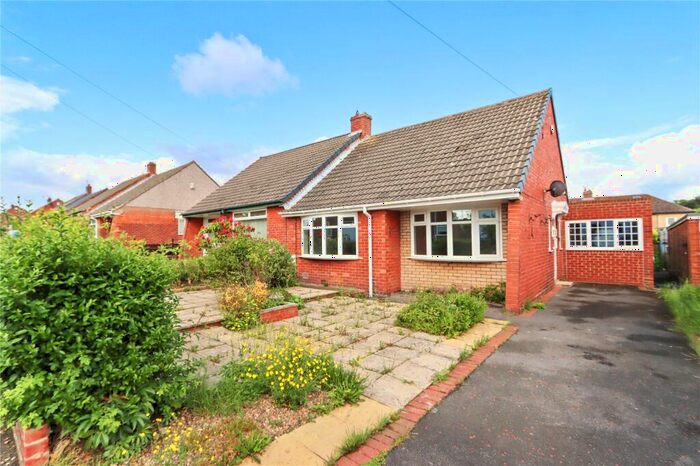
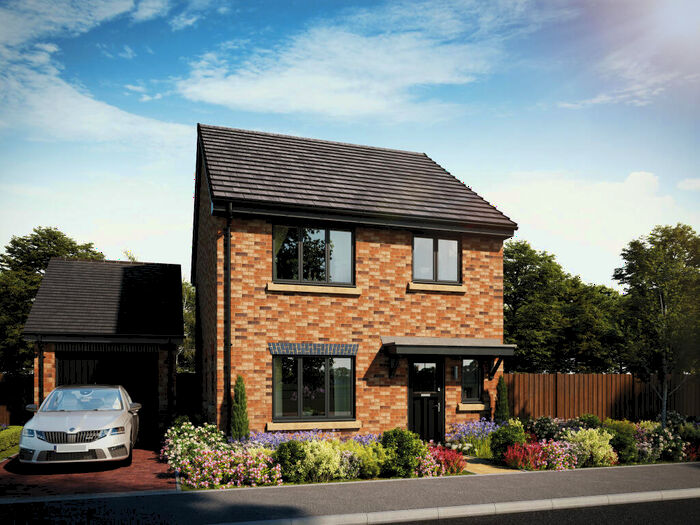
Properties for sale in Newcastle Upon Tyne


Neighbourhoods in Newcastle Upon Tyne
Navigate through our locations to find the location of your next house in Newcastle Upon Tyne, Gateshead for sale or to rent.
Transport in Newcastle Upon Tyne
Please see below transportation links in this area:

- FAQ
- Price Paid By Year
- Property Type Price
Frequently asked questions about Newcastle Upon Tyne
What is the average price for a property for sale in Newcastle Upon Tyne?
The average price for a property for sale in Newcastle Upon Tyne is £201,394. This amount is 21% higher than the average price in Gateshead. There are more than 10,000 property listings for sale in Newcastle Upon Tyne.
What locations have the most expensive properties for sale in Newcastle Upon Tyne?
The locations with the most expensive properties for sale in Newcastle Upon Tyne are Lamesley at an average of £397,500, Dunston Hill And Whickham East at an average of £324,290 and Whickham South And Sunniside at an average of £240,183.
What locations have the most affordable properties for sale in Newcastle Upon Tyne?
The locations with the most affordable properties for sale in Newcastle Upon Tyne are Chopwell And Rowlands Gill at an average of £100,059 and Whickham North at an average of £170,273.
Which train stations are available in or near Newcastle Upon Tyne?
Some of the train stations available in or near Newcastle Upon Tyne are Blaydon, MetroCentre and Dunston.
Property Price Paid in Newcastle Upon Tyne by Year
The average sold property price by year was:
| Year | Average Sold Price | Price Change |
Sold Properties
|
|---|---|---|---|
| 2024 | £207,900 | 2% |
25 Properties |
| 2023 | £204,722 | 9% |
286 Properties |
| 2022 | £186,236 | -14% |
396 Properties |
| 2021 | £212,090 | 2% |
457 Properties |
| 2020 | £207,594 | 11% |
329 Properties |
| 2019 | £184,147 | 8% |
341 Properties |
| 2018 | £168,956 | 0,5% |
351 Properties |
| 2017 | £168,145 | 3% |
359 Properties |
| 2016 | £163,889 | 3% |
339 Properties |
| 2015 | £158,981 | -0,1% |
338 Properties |
| 2014 | £159,068 | 4% |
367 Properties |
| 2013 | £152,204 | 0,2% |
340 Properties |
| 2012 | £151,843 | 3% |
263 Properties |
| 2011 | £147,984 | 0,5% |
245 Properties |
| 2010 | £147,301 | -7% |
243 Properties |
| 2009 | £157,317 | 5% |
265 Properties |
| 2008 | £149,185 | -3% |
285 Properties |
| 2007 | £153,599 | 5% |
625 Properties |
| 2006 | £145,630 | 7% |
537 Properties |
| 2005 | £135,776 | 6% |
503 Properties |
| 2004 | £127,538 | 14% |
597 Properties |
| 2003 | £109,673 | 20% |
638 Properties |
| 2002 | £87,999 | 15% |
604 Properties |
| 2001 | £74,899 | 7% |
486 Properties |
| 2000 | £69,398 | 7% |
430 Properties |
| 1999 | £64,683 | - |
447 Properties |
| 1998 | £64,654 | 9% |
482 Properties |
| 1997 | £58,598 | -0,4% |
404 Properties |
| 1996 | £58,843 | 8% |
404 Properties |
| 1995 | £54,200 | - |
337 Properties |
Property Price per Property Type in Newcastle Upon Tyne
Here you can find historic sold price data in order to help with your property search.
The average Property Paid Price for specific property types in the last three years are:
| Property Type | Average Sold Price | Sold Properties |
|---|---|---|
| Semi Detached House | £206,102.00 | 362 Semi Detached Houses |
| Terraced House | £131,184.00 | 426 Terraced Houses |
| Detached House | £366,569.00 | 250 Detached Houses |
| Flat | £97,516.00 | 126 Flats |