
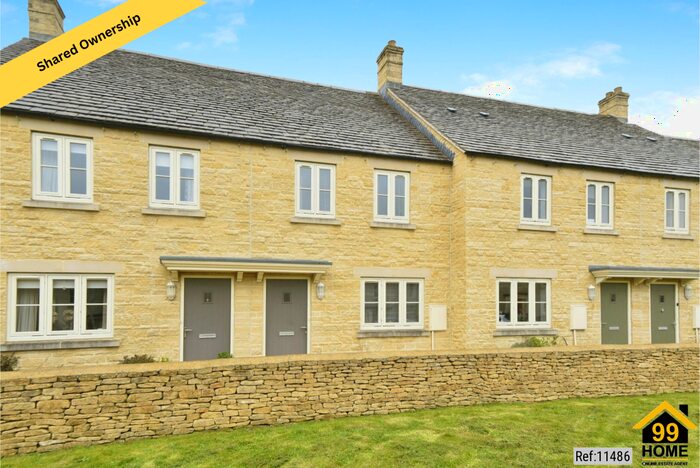
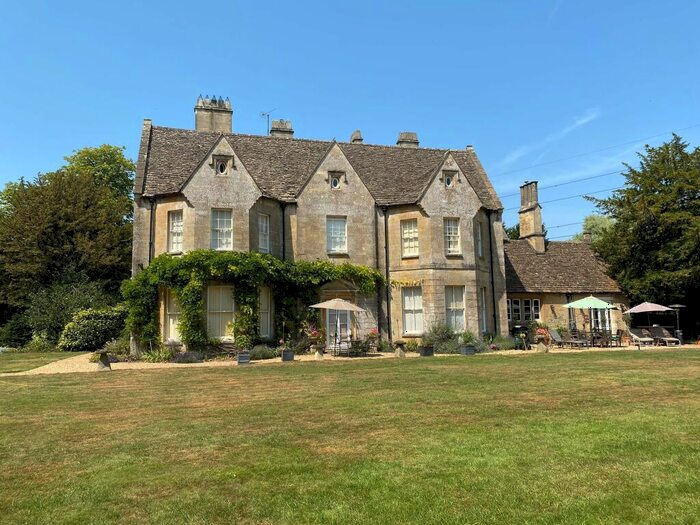
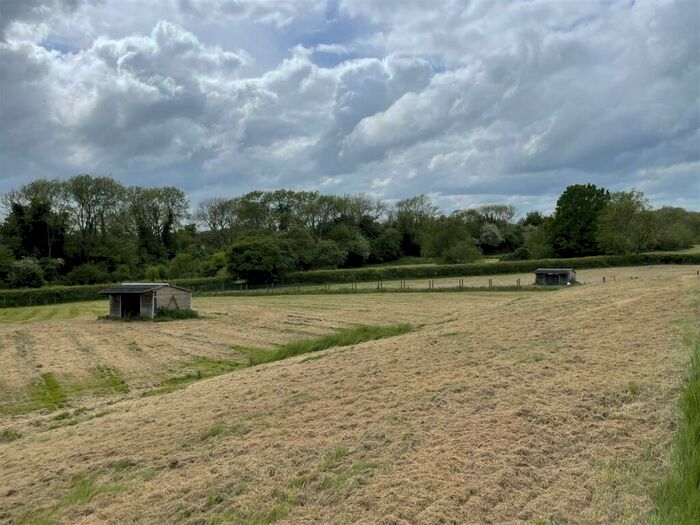
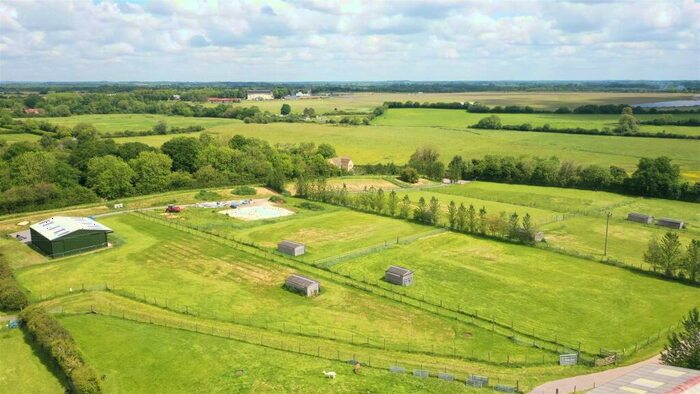
Houses for sale & to rent in Cirencester, Gloucestershire
House Prices in Cirencester
Properties in Cirencester have an average house price of £499,322.00 and had 1,778 Property Transactions within the last 3 years.¹
Cirencester is an area in Gloucestershire with 14,670 households², where the most expensive property was sold for £6,200,000.00.
Properties for sale in Cirencester


Neighbourhoods in Cirencester
Navigate through our locations to find the location of your next house in Cirencester, Gloucestershire for sale or to rent.
- Ampney-coln
- Avening
- Bisley
- Churn Valley
- Cirencester Beeches
- Cirencester Chesterton
- Cirencester Park
- Cirencester Stratton-whiteway
- Cirencester Watermoor
- Ermin
- Fairford
- Hampton
- Riversmeet
- Thames Head
- Water Park
- Watermoor
- New Mills
- The Beeches
- St Michael's
- Four Acres
- Siddington & Cerney Rural
- Lechlade, Kempsford & Fairford South
- Coln Valley
- Fairford North
- The Ampneys & Hampton
- Chedworth & Churn Valley
- South Cerney Village
- Kemble
- Chesterton
- Stratton
Transport in Cirencester
Please see below transportation links in this area:

- FAQ
- Price Paid By Year
- Property Type Price
Frequently asked questions about Cirencester
What is the average price for a property for sale in Cirencester?
The average price for a property for sale in Cirencester is £499,322. This amount is 31% higher than the average price in Gloucestershire. There are more than 10,000 property listings for sale in Cirencester.
What locations have the most expensive properties for sale in Cirencester?
The locations with the most expensive properties for sale in Cirencester are Lechlade, Kempsford & Fairford South at an average of £1,453,646, Riversmeet at an average of £1,397,927 and Bisley at an average of £1,240,000.
What locations have the most affordable properties for sale in Cirencester?
The locations with the most affordable properties for sale in Cirencester are Watermoor at an average of £172,600, New Mills at an average of £225,865 and Chesterton at an average of £250,000.
Which train stations are available in or near Cirencester?
Some of the train stations available in or near Cirencester are Kemble, Swindon and Stroud.
Property Price Paid in Cirencester by Year
The average sold property price by year was:
| Year | Average Sold Price | Price Change |
Sold Properties
|
|---|---|---|---|
| 2024 | £413,125 | -29% |
36 Properties |
| 2023 | £531,991 | 3% |
397 Properties |
| 2022 | £514,884 | 8% |
548 Properties |
| 2021 | £476,243 | 3% |
797 Properties |
| 2020 | £459,814 | 14% |
551 Properties |
| 2019 | £393,911 | 2% |
538 Properties |
| 2018 | £386,091 | -1% |
585 Properties |
| 2017 | £388,327 | 5% |
702 Properties |
| 2016 | £367,306 | -1% |
716 Properties |
| 2015 | £369,908 | 11% |
632 Properties |
| 2014 | £329,976 | 2% |
667 Properties |
| 2013 | £324,127 | 6% |
561 Properties |
| 2012 | £304,916 | 1% |
514 Properties |
| 2011 | £300,440 | -1% |
498 Properties |
| 2010 | £304,735 | 5% |
453 Properties |
| 2009 | £289,789 | -2% |
428 Properties |
| 2008 | £296,185 | 2% |
372 Properties |
| 2007 | £289,270 | 12% |
754 Properties |
| 2006 | £253,235 | -2% |
793 Properties |
| 2005 | £259,361 | 7% |
570 Properties |
| 2004 | £241,213 | 3% |
694 Properties |
| 2003 | £233,026 | 18% |
721 Properties |
| 2002 | £191,114 | 14% |
768 Properties |
| 2001 | £164,626 | 5% |
784 Properties |
| 2000 | £157,113 | 12% |
687 Properties |
| 1999 | £137,703 | 13% |
791 Properties |
| 1998 | £119,204 | 5% |
682 Properties |
| 1997 | £113,430 | 19% |
700 Properties |
| 1996 | £92,069 | 1% |
686 Properties |
| 1995 | £90,694 | - |
562 Properties |
Property Price per Property Type in Cirencester
Here you can find historic sold price data in order to help with your property search.
The average Property Paid Price for specific property types in the last three years are:
| Property Type | Average Sold Price | Sold Properties |
|---|---|---|
| Terraced House | £346,356.00 | 446 Terraced Houses |
| Flat | £199,180.00 | 280 Flats |
| Semi Detached House | £428,456.00 | 439 Semi Detached Houses |
| Detached House | £798,462.00 | 613 Detached Houses |