
Houses for sale & to rent in Windmill Hill, Runcorn
House Prices in Windmill Hill
Properties in Windmill Hill have an average house price of £119,935.00 and had 21 Property Transactions within the last 3 years¹.
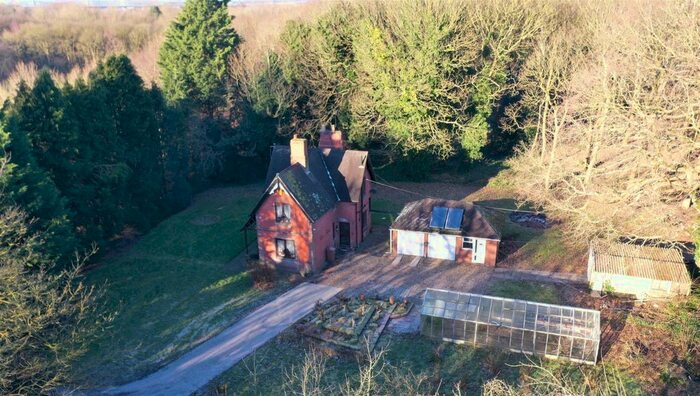
Windmill Hill is an area in Runcorn, Halton with 961 households², where the most expensive property was sold for £365,000.00.
Properties for sale in Windmill Hill


Previously listed properties in Windmill Hill


Roads and Postcodes in Windmill Hill
Navigate through our locations to find the location of your next house in Windmill Hill, Runcorn for sale or to rent.
| Streets | Postcodes |
|---|---|
| Bridgeway East | WA7 6LD |
| Bridgeway West | WA7 6LG WA7 6LQ |
| Canal Reach | WA7 6LA |
| Eastwood | WA7 6LJ |
| Hornbeam Close | WA7 6QL |
| Lockgate East | WA7 6LB |
| Lockgate West | WA7 6LE WA7 6LF |
| Norton Hill | WA7 6QE WA7 6QF WA7 6QH |
| Nortonwood Lane | WA7 6QG WA7 6QQ |
| Stonelea | WA7 6LH |
| Townfield View | WA7 6QD |
| Westwood | WA7 6LL WA7 6LN |
| Woodridge | WA7 6LP WA7 6LW |
| WA7 1QZ |
Transport near Windmill Hill
-
 Runcorn East Station
 -
Runcorn Station
-
Frodsham Station
-
Widnes Station
-
Sankey For Penketh Station
-
Warrington Bank Quay Station
-
Hough Green Station
-
Warrington Central Station
- FAQ
- Price Paid By Year
- Property Type Price
Frequently asked questions about Windmill Hill
What is the average price for a property for sale in Windmill Hill?
The average price for a property for sale in Windmill Hill is £119,935. This amount is 31% lower than the average price in Runcorn. There are 93 property listings for sale in Windmill Hill.
What streets have the most expensive properties for sale in Windmill Hill?
The streets with the most expensive properties for sale in Windmill Hill are Lockgate West at an average of £130,787, Westwood at an average of £120,500 and Bridgeway West at an average of £115,375.
What streets have the most affordable properties for sale in Windmill Hill?
The streets with the most affordable properties for sale in Windmill Hill are Bridgeway East at an average of £68,000, Nortonwood Lane at an average of £90,000 and Canal Reach at an average of £101,500.
Which train stations are available in or near Windmill Hill?
Some of the train stations available in or near Windmill Hill are Runcorn East, Runcorn and Frodsham.
Property Price Paid in Windmill Hill by Year
The average sold property price by year was:
| Year | Average Sold Price | Price Change |
Sold Properties
|
|---|---|---|---|
| 2024 | £110,000 | -14% |
1 Property |
| 2023 | £125,875 | 11% |
4 Properties |
| 2022 | £111,794 | -15% |
9 Properties |
| 2021 | £128,428 | 34% |
7 Properties |
| 2020 | £84,848 | -2% |
9 Properties |
| 2019 | £86,222 | 13% |
9 Properties |
| 2018 | £75,187 | 3% |
8 Properties |
| 2017 | £72,625 | -29% |
6 Properties |
| 2016 | £93,886 | 30% |
11 Properties |
| 2015 | £65,618 | -6% |
8 Properties |
| 2014 | £69,500 | 5% |
4 Properties |
| 2013 | £66,356 | 8% |
8 Properties |
| 2012 | £60,833 | -8% |
3 Properties |
| 2011 | £65,625 | 18% |
8 Properties |
| 2010 | £53,625 | -5% |
4 Properties |
| 2009 | £56,475 | -46% |
2 Properties |
| 2008 | £82,700 | 0,4% |
6 Properties |
| 2007 | £82,407 | 12% |
13 Properties |
| 2006 | £72,250 | 7% |
10 Properties |
| 2005 | £67,100 | 15% |
13 Properties |
| 2004 | £57,050 | 6% |
8 Properties |
| 2003 | £53,655 | 40% |
20 Properties |
| 2002 | £32,250 | 13% |
9 Properties |
| 2001 | £28,125 | 10% |
4 Properties |
| 2000 | £25,404 | 3% |
11 Properties |
| 1999 | £24,558 | -6% |
6 Properties |
| 1998 | £25,916 | 17% |
3 Properties |
| 1997 | £21,488 | -30% |
9 Properties |
| 1996 | £27,968 | 8% |
8 Properties |
| 1995 | £25,666 | - |
6 Properties |
Property Price per Property Type in Windmill Hill
Here you can find historic sold price data in order to help with your property search.
The average Property Paid Price for specific property types in the last three years are:
| Property Type | Average Sold Price | Sold Properties |
|---|---|---|
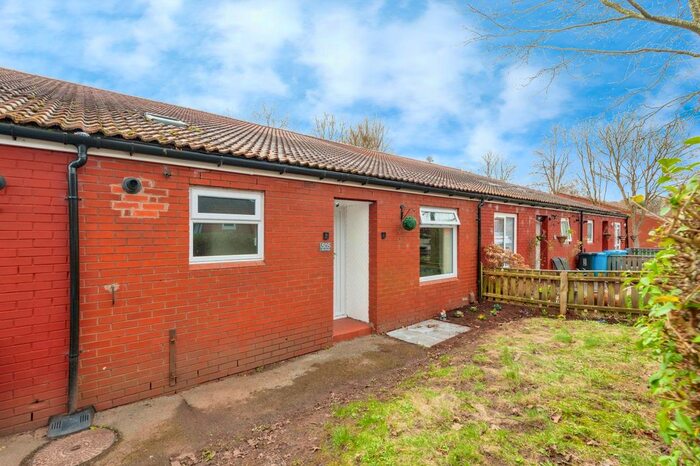
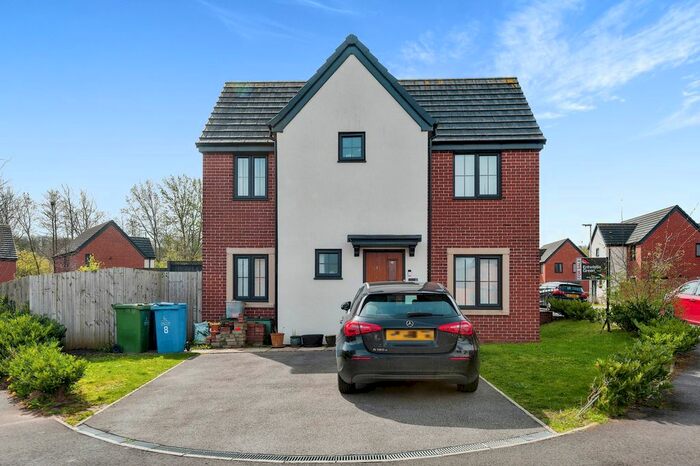
| Terraced House | £109,771.00 | 19 Terraced Houses |
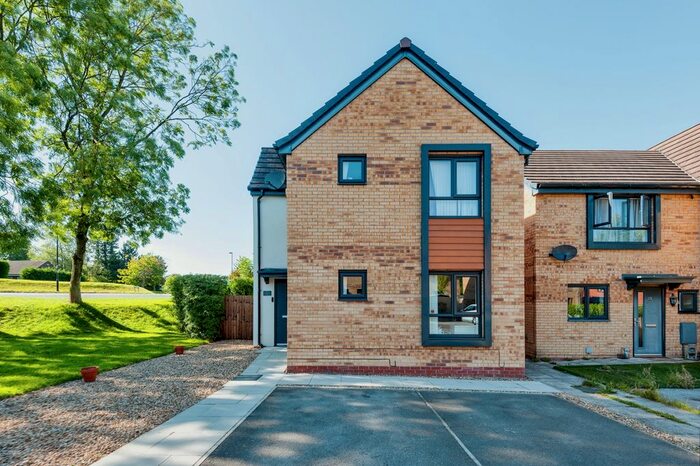
| Semi Detached House | £68,000.00 | 1 Semi Detached House |
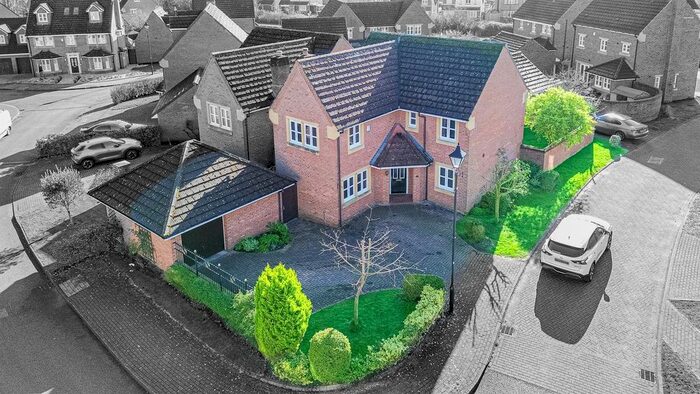
| Detached House | £365,000.00 | 1 Detached House |