
Houses for sale & to rent in Binsted And Bentley, Bordon
House Prices in Binsted And Bentley
Properties in Binsted And Bentley have an average house price of £896,843.00 and had 16 Property Transactions within the last 3 years¹.
Binsted And Bentley is an area in Bordon, Hampshire with 92 households², where the most expensive property was sold for £2,240,000.00.
Properties for sale in Binsted And Bentley


Previously listed properties in Binsted And Bentley

Roads and Postcodes in Binsted And Bentley
Navigate through our locations to find the location of your next house in Binsted And Bentley, Bordon for sale or to rent.
| Streets | Postcodes |
|---|---|
| Cradle Lane | GU35 0QT |
| Farnham Road | GU35 0QX |
| Frith End | GU35 0QY GU35 0QZ GU35 0RA |
| South Hay | GU35 9NR |
| The Kilns | GU35 0QN GU35 0QW |
| The Straits | GU35 9NS GU35 9NU |
| Wheatley Lane | GU35 9NX GU35 9NY |
| Wheatley Place | GU35 9PA |
Transport near Binsted And Bentley
-
 Bentley Station
 -
Alton Station
-
Farnham Station
-
Liphook Station
-
Liss Station
-
Haslemere Station
-
Aldershot Station
-
Winchfield Station
-
Ash Station
-
Witley Station
- FAQ
- Price Paid By Year
- Property Type Price
Frequently asked questions about Binsted And Bentley
What is the average price for a property for sale in Binsted And Bentley?
The average price for a property for sale in Binsted And Bentley is £896,843. This amount is 72% higher than the average price in Bordon. There are 186 property listings for sale in Binsted And Bentley.
What streets have the most expensive properties for sale in Binsted And Bentley?
The streets with the most expensive properties for sale in Binsted And Bentley are South Hay at an average of £1,511,250 and Wheatley Lane at an average of £978,000.
What streets have the most affordable properties for sale in Binsted And Bentley?
The streets with the most affordable properties for sale in Binsted And Bentley are The Kilns at an average of £780,000 and Frith End at an average of £793,714.
Which train stations are available in or near Binsted And Bentley?
Some of the train stations available in or near Binsted And Bentley are Bentley, Alton and Farnham.
Property Price Paid in Binsted And Bentley by Year
The average sold property price by year was:
| Year | Average Sold Price | Price Change |
Sold Properties
|
|---|---|---|---|
| 2023 | £697,500 | -75% |
2 Properties |
| 2022 | £1,223,125 | 34% |
4 Properties |
| 2021 | £806,200 | -12% |
10 Properties |
| 2020 | £900,000 | 41% |
1 Property |
| 2019 | £533,333 | 31% |
3 Properties |
| 2018 | £366,000 | -72% |
1 Property |
| 2017 | £630,833 | -53% |
6 Properties |
| 2016 | £965,000 | 59% |
1 Property |
| 2015 | £397,666 | -40% |
3 Properties |
| 2014 | £557,200 | 40% |
5 Properties |
| 2013 | £335,000 | -117% |
2 Properties |
| 2012 | £726,875 | 26% |
4 Properties |
| 2011 | £540,000 | -31% |
2 Properties |
| 2010 | £705,000 | -34% |
2 Properties |
| 2009 | £942,500 | 42% |
4 Properties |
| 2008 | £550,000 | -13% |
2 Properties |
| 2007 | £618,875 | -1% |
8 Properties |
| 2006 | £623,375 | 30% |
4 Properties |
| 2005 | £438,000 | 3% |
4 Properties |
| 2004 | £424,375 | -24% |
4 Properties |
| 2003 | £525,142 | -12% |
7 Properties |
| 2002 | £587,318 | 40% |
8 Properties |
| 2001 | £354,750 | 39% |
2 Properties |
| 2000 | £215,000 | -51% |
2 Properties |
| 1999 | £324,024 | 25% |
4 Properties |
| 1998 | £243,385 | 25% |
7 Properties |
| 1997 | £181,333 | -5% |
3 Properties |
| 1996 | £191,125 | 13% |
4 Properties |
| 1995 | £166,158 | - |
6 Properties |
Property Price per Property Type in Binsted And Bentley
Here you can find historic sold price data in order to help with your property search.
The average Property Paid Price for specific property types in the last three years are:
| Property Type | Average Sold Price | Sold Properties |
|---|---|---|
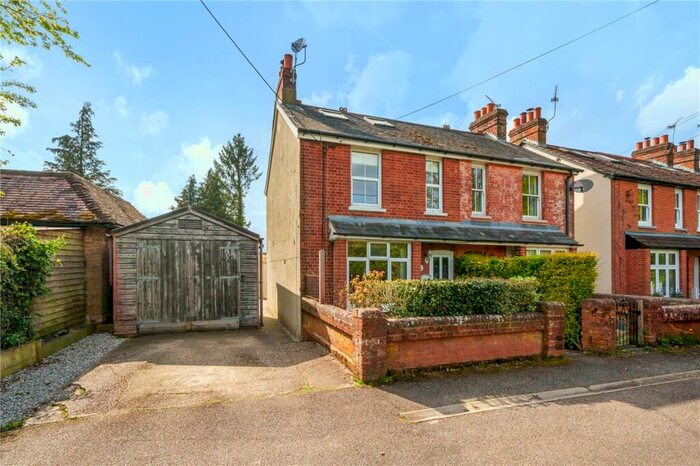
| Semi Detached House | £686,500.00 | 4 Semi Detached Houses |
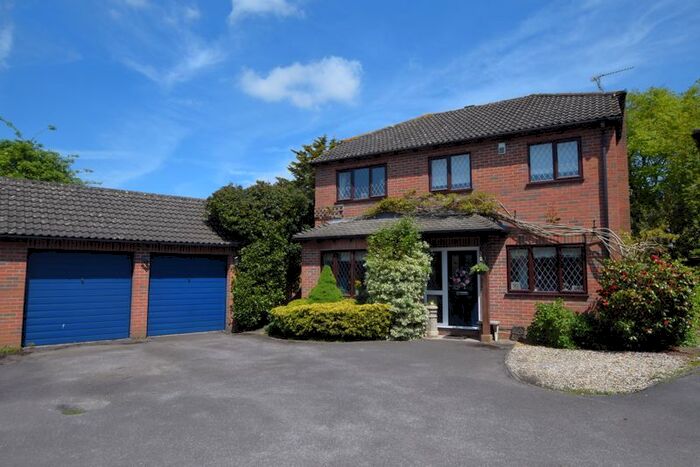
| Detached House | £1,016,227.00 | 11 Detached Houses |
| Terraced House | £425,000.00 | 1 Terraced House |