
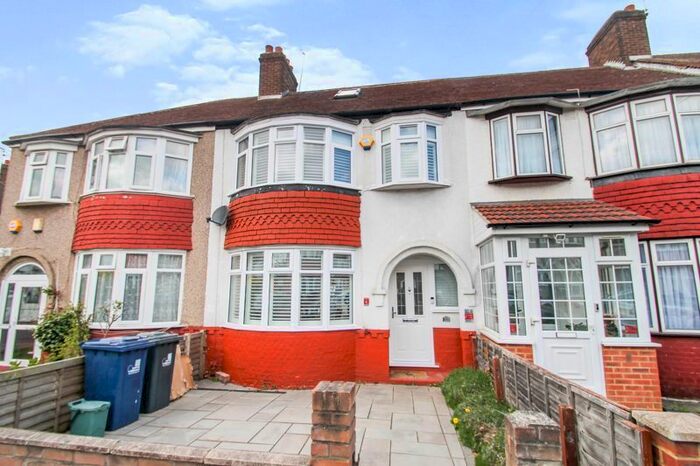
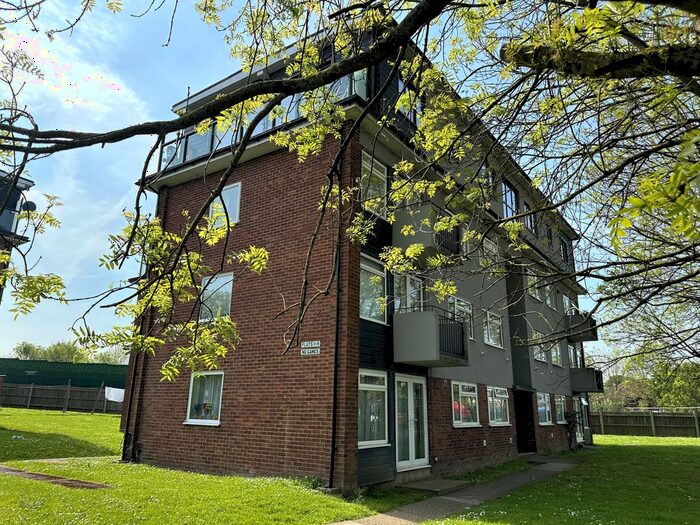
Houses for sale & to rent in Roxeth, Northolt
House Prices in Roxeth
Properties in this part of Roxeth within Northolt have an average house price of £458,031.00 and had 22 Property Transactions within the last 3 years¹. This area has 469 households² , where the most expensive property was sold for £610,000.00.
Properties for sale in Roxeth


Roads and Postcodes in Roxeth
Navigate through our locations to find the location of your next house in Roxeth, Northolt for sale or to rent.
| Streets | Postcodes |
|---|---|
| Dabbs Hill Lane | UB5 4DD |
| Doncaster Drive | UB5 4AY |
| Doncaster Gardens | UB5 4BN |
| Gaylor Road | UB5 4BD UB5 4BB |
| Greenacre Close | UB5 4DT |
| Mallet Drive | UB5 4BE |
| Martin Drive | UB5 4BG |
| Silverdale Close | UB5 4BL |
| The Heights | UB5 4BP UB5 4BS UB5 4BT UB5 4BU UB5 4BW UB5 4BX UB5 4BY |
| The Link | UB5 4BQ |
Transport near Roxeth
-
 Northolt Station
 -
 Northolt Park Station
 -
South Harrow Station
-
South Ruislip Station
-
Rayners Lane Station
-
Greenford Station
-
Sudbury Hill Station
-
Sudbury Hill Harrow Station
-
Ruislip Gardens Station
-
Eastcote Station
- FAQ
- Price Paid By Year
- Property Type Price
Frequently asked questions about Roxeth
What is the average price for a property for sale in Roxeth?
The average price for a property for sale in Roxeth is £458,031. There are 1,918 property listings for sale in Roxeth.
What streets have the most expensive properties for sale in Roxeth?
The streets with the most expensive properties for sale in Roxeth are The Heights at an average of £485,263, Doncaster Gardens at an average of £470,000 and Doncaster Drive at an average of £413,500.
What streets have the most affordable properties for sale in Roxeth?
The streets with the most affordable properties for sale in Roxeth are Greenacre Close at an average of £336,000 and Mallet Drive at an average of £410,000.
Which train stations are available in or near Roxeth?
Some of the train stations available in or near Roxeth are Northolt Park, South Ruislip and Greenford.
Which tube stations are available in or near Roxeth?
Some of the tube stations available in or near Roxeth are Northolt, South Harrow and South Ruislip.
Property Price Paid in Roxeth by Year
The average sold property price by year was:
| Year | Average Sold Price | Price Change |
Sold Properties
|
|---|---|---|---|
| 2024 | £410,000 | -29% |
1 Property |
| 2023 | £530,000 | 26% |
8 Properties |
| 2022 | £391,750 | -9% |
4 Properties |
| 2021 | £428,855 | 6% |
9 Properties |
| 2020 | £404,633 | 6% |
9 Properties |
| 2019 | £378,928 | -17% |
7 Properties |
| 2018 | £442,995 | 10% |
11 Properties |
| 2017 | £399,818 | 5% |
11 Properties |
| 2016 | £381,778 | 13% |
7 Properties |
| 2015 | £333,000 | 13% |
15 Properties |
| 2014 | £289,325 | 10% |
15 Properties |
| 2013 | £261,817 | 14% |
14 Properties |
| 2012 | £224,666 | -12% |
3 Properties |
| 2011 | £250,954 | 4% |
11 Properties |
| 2010 | £240,111 | 15% |
9 Properties |
| 2009 | £205,118 | -24% |
8 Properties |
| 2008 | £253,800 | 13% |
8 Properties |
| 2007 | £219,963 | -12% |
22 Properties |
| 2006 | £246,199 | 10% |
17 Properties |
| 2005 | £221,103 | 30% |
14 Properties |
| 2004 | £155,837 | -28% |
8 Properties |
| 2003 | £199,332 | 26% |
26 Properties |
| 2002 | £148,051 | 0,2% |
27 Properties |
| 2001 | £147,765 | 19% |
16 Properties |
| 2000 | £119,879 | 17% |
17 Properties |
| 1999 | £98,969 | 11% |
30 Properties |
| 1998 | £88,552 | 6% |
22 Properties |
| 1997 | £83,491 | 14% |
23 Properties |
| 1996 | £71,846 | 8% |
13 Properties |
| 1995 | £65,770 | - |
10 Properties |
Property Price per Property Type in Roxeth
Here you can find historic sold price data in order to help with your property search.
The average Property Paid Price for specific property types in the last three years are:
| Property Type | Average Sold Price | Sold Properties |
|---|---|---|
| Semi Detached House | £508,641.00 | 12 Semi Detached Houses |
| Terraced House | £443,285.00 | 7 Terraced Houses |
| Flat | £290,000.00 | 3 Flats |