
Houses for sale & to rent in St Margarets-at-cliffe, Deal
House Prices in St Margarets-at-cliffe
Properties in St Margarets-at-cliffe have an average house price of £486,022.00 and had 22 Property Transactions within the last 3 years¹.
St Margarets-at-cliffe is an area in Deal, Kent with 149 households², where the most expensive property was sold for £1,175,000.00.
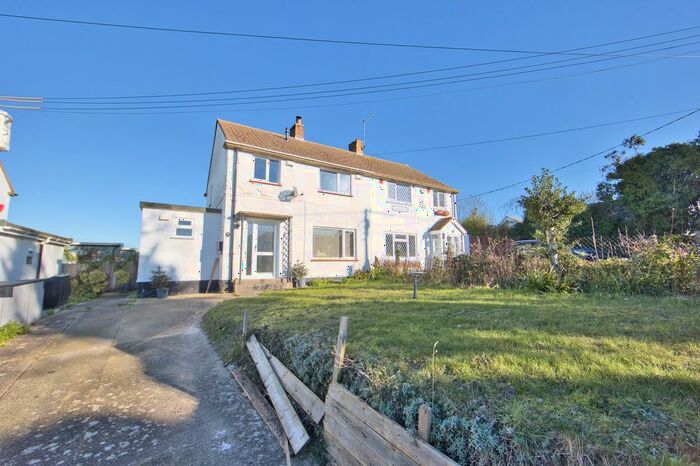
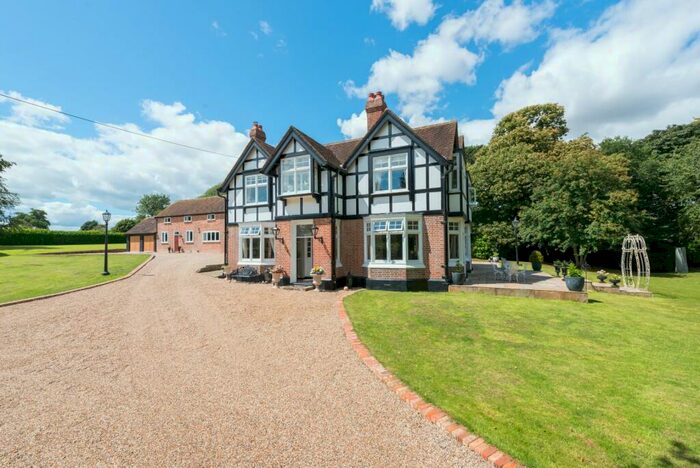
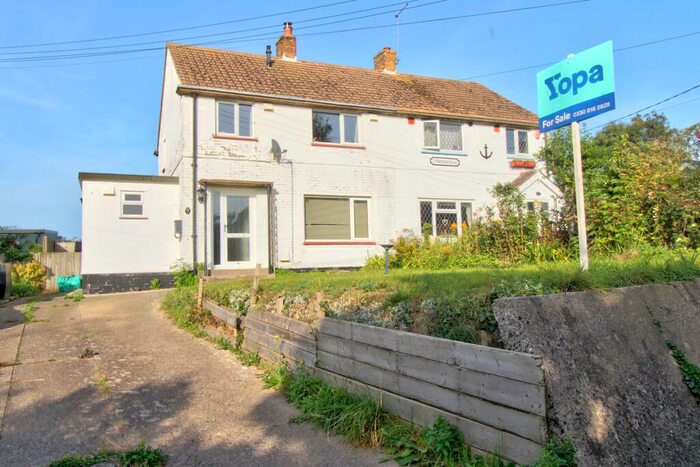
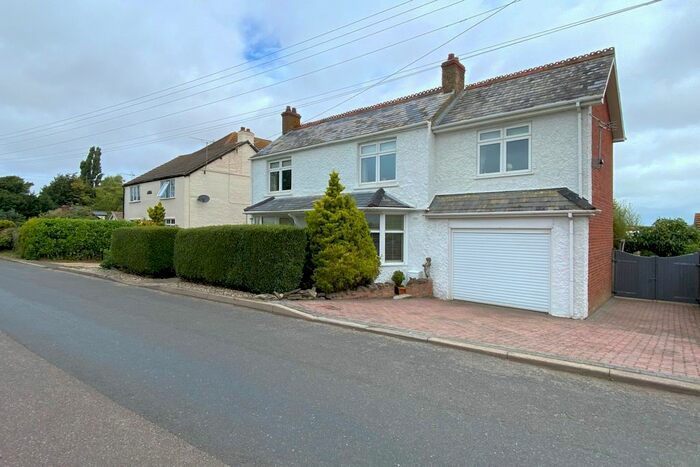
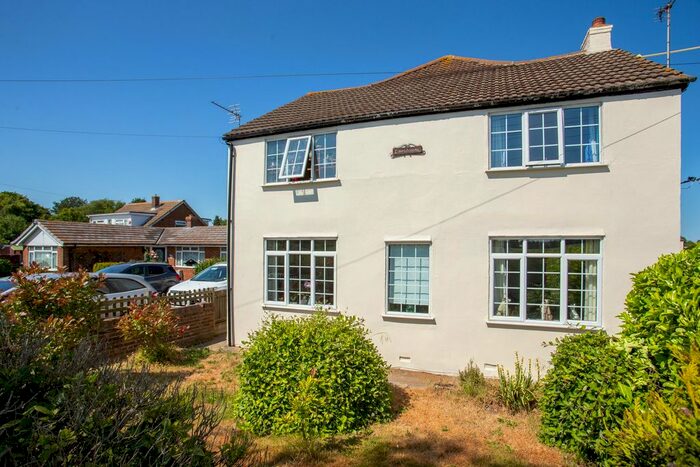
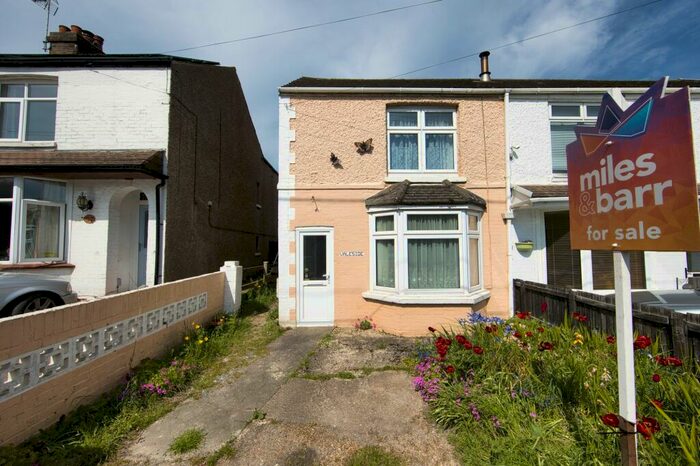
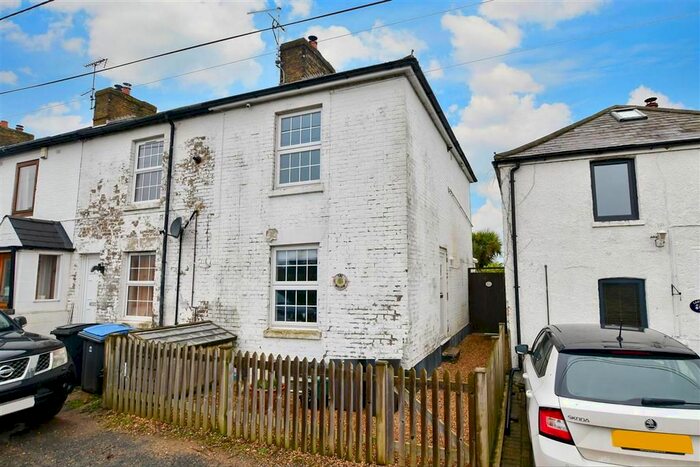
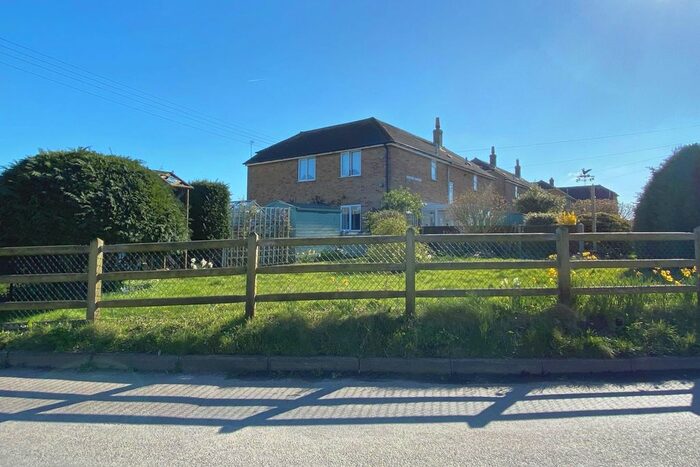
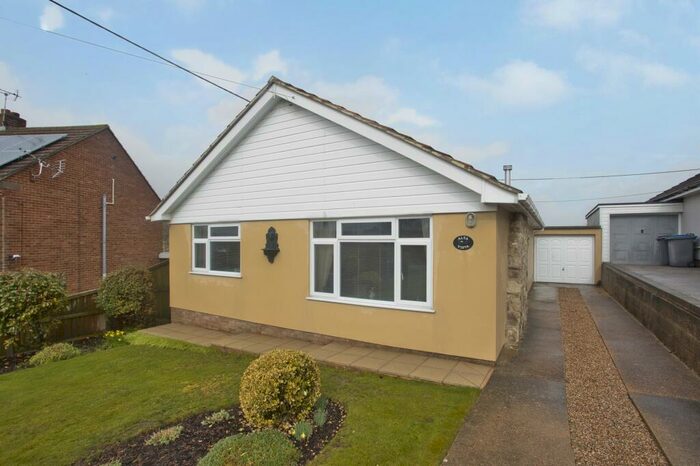
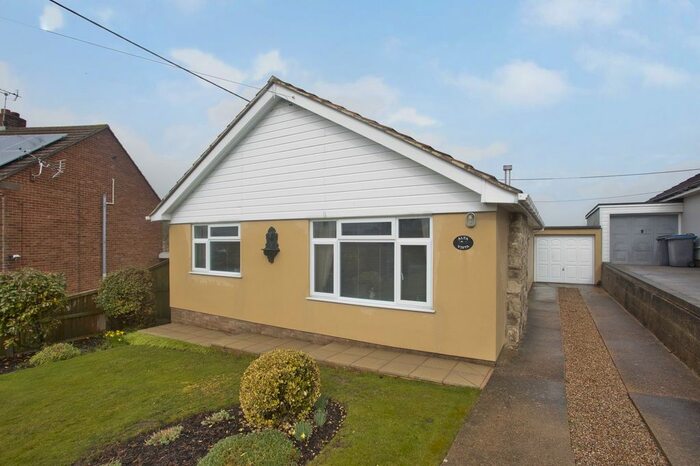
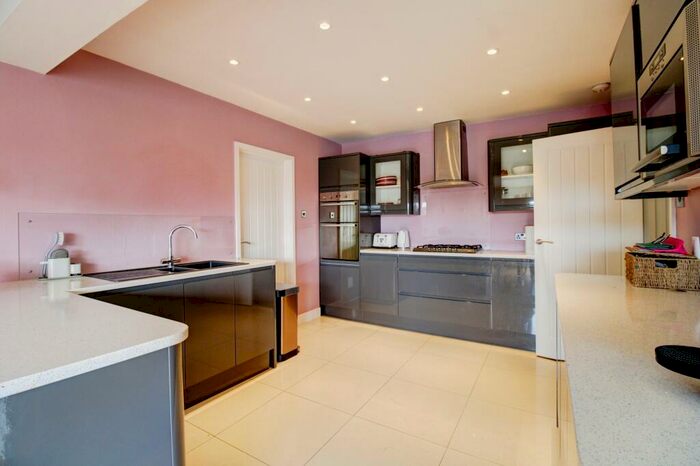
Properties for sale in St Margarets-at-cliffe


Previously listed properties in St Margarets-at-cliffe


Roads and Postcodes in St Margarets-at-cliffe
Navigate through our locations to find the location of your next house in St Margarets-at-cliffe, Deal for sale or to rent.
| Streets | Postcodes |
|---|---|
| Burgess Cottages | CT14 8JW |
| Chapel Lane | CT14 8JG |
| Church Lane | CT14 8JH CT14 8JL |
| Coronation Villas | CT14 8JF |
| Cranswick Cottages | CT14 8JD |
| Dover Road | CT14 7PE CT14 7PF CT14 7PG CT14 7PQ CT14 8HD |
| Mantles Hill | CT14 8JN |
| May Tree Cottages | CT14 8JE |
| Portland Terrace | CT14 8JJ |
| Sunnyside Close | CT14 8JP |
| Thanet View | CT14 8HX |
| CT14 8HY CT14 8JA CT14 8JB |
Transport near St Margarets-at-cliffe

- FAQ
- Price Paid By Year
- Property Type Price
Frequently asked questions about St Margarets-at-cliffe
What is the average price for a property for sale in St Margarets-at-cliffe?
The average price for a property for sale in St Margarets-at-cliffe is £486,022. This amount is 27% higher than the average price in Deal. There are 50 property listings for sale in St Margarets-at-cliffe.
What streets have the most expensive properties for sale in St Margarets-at-cliffe?
The streets with the most expensive properties for sale in St Margarets-at-cliffe are Burgess Cottages at an average of £502,500 and Mantles Hill at an average of £455,000.
What streets have the most affordable properties for sale in St Margarets-at-cliffe?
The streets with the most affordable properties for sale in St Margarets-at-cliffe are Portland Terrace at an average of £265,333 and Cranswick Cottages at an average of £402,500.
Which train stations are available in or near St Margarets-at-cliffe?
Some of the train stations available in or near St Margarets-at-cliffe are Walmer, Martin Mill and Deal.
Property Price Paid in St Margarets-at-cliffe by Year
The average sold property price by year was:
| Year | Average Sold Price | Price Change |
Sold Properties
|
|---|---|---|---|
| 2023 | £510,000 | 10% |
4 Properties |
| 2022 | £461,142 | -7% |
7 Properties |
| 2021 | £493,136 | 38% |
11 Properties |
| 2020 | £303,400 | -18% |
5 Properties |
| 2019 | £358,375 | 2% |
8 Properties |
| 2018 | £350,833 | 8% |
6 Properties |
| 2017 | £322,500 | 2% |
3 Properties |
| 2016 | £317,100 | 19% |
5 Properties |
| 2015 | £255,666 | 30% |
6 Properties |
| 2014 | £179,987 | -61% |
4 Properties |
| 2013 | £290,375 | 22% |
8 Properties |
| 2012 | £227,000 | 3% |
5 Properties |
| 2011 | £219,500 | 16% |
5 Properties |
| 2010 | £185,000 | -17% |
6 Properties |
| 2009 | £216,333 | -80% |
3 Properties |
| 2008 | £390,000 | 53% |
1 Property |
| 2007 | £184,812 | -1% |
8 Properties |
| 2006 | £185,777 | -11% |
9 Properties |
| 2005 | £206,237 | 22% |
4 Properties |
| 2004 | £161,642 | -9% |
7 Properties |
| 2003 | £175,575 | 19% |
6 Properties |
| 2002 | £141,437 | 23% |
8 Properties |
| 2001 | £108,790 | 20% |
5 Properties |
| 2000 | £86,986 | -19% |
4 Properties |
| 1999 | £103,166 | 35% |
3 Properties |
| 1998 | £67,199 | -8% |
5 Properties |
| 1997 | £72,500 | -4% |
4 Properties |
| 1996 | £75,650 | 29% |
5 Properties |
| 1995 | £53,600 | - |
5 Properties |
Property Price per Property Type in St Margarets-at-cliffe
Here you can find historic sold price data in order to help with your property search.
The average Property Paid Price for specific property types in the last three years are:
| Property Type | Average Sold Price | Sold Properties |
|---|---|---|
| Semi Detached House | £339,200.00 | 5 Semi Detached Houses |
| Terraced House | £264,000.00 | 4 Terraced Houses |
| Detached House | £610,807.00 | 13 Detached Houses |