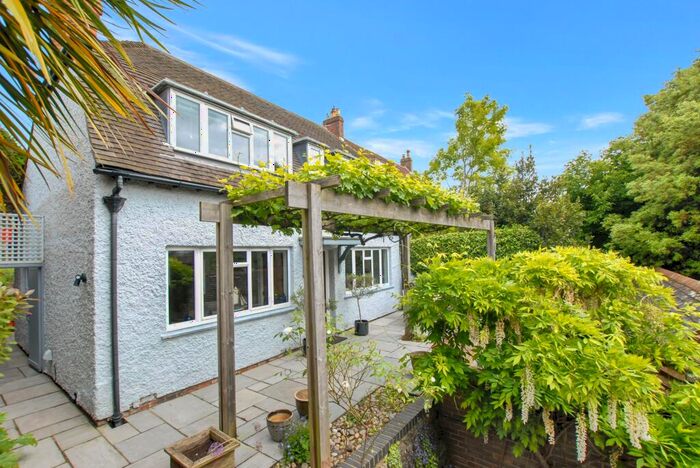
Houses for sale & to rent in Hythe, Hythe
House Prices in Hythe
Properties in Hythe have an average house price of £425,212.00 and had 31 Property Transactions within the last 3 years¹.
Hythe is an area in Hythe, Kent with 249 households², where the most expensive property was sold for £1,000,000.00.
Properties for sale in Hythe
Roads and Postcodes in Hythe
Navigate through our locations to find the location of your next house in Hythe, Hythe for sale or to rent.
Transport near Hythe
- FAQ
- Price Paid By Year
- Property Type Price
Frequently asked questions about Hythe
What is the average price for a property for sale in Hythe?
The average price for a property for sale in Hythe is £425,212. This amount is 0.83% higher than the average price in Hythe. There are 1,707 property listings for sale in Hythe.
What streets have the most expensive properties for sale in Hythe?
The streets with the most expensive properties for sale in Hythe are Imperial Gardens at an average of £797,500, Blackhouse Hill at an average of £603,333 and Fishermans Beach at an average of £496,000.
What streets have the most affordable properties for sale in Hythe?
The streets with the most affordable properties for sale in Hythe are Sir John Moore Avenue at an average of £77,416, Palmer Drive at an average of £114,500 and Prospect Road at an average of £453,575.
Which train stations are available in or near Hythe?
Some of the train stations available in or near Hythe are Sandling, Westenhanger and Folkestone West.
Property Price Paid in Hythe by Year
The average sold property price by year was:
| Year | Average Sold Price | Price Change |
Sold Properties
|
|---|---|---|---|
| 2023 | £64,125 | -634% |
2 Properties |
| 2022 | £470,625 | 6% |
8 Properties |
| 2021 | £442,302 | -35% |
21 Properties |
| 2020 | £597,285 | 38% |
14 Properties |
| 2019 | £369,019 | -39% |
13 Properties |
| 2018 | £514,727 | -19% |
22 Properties |
| 2017 | £612,140 | 27% |
25 Properties |
| 2016 | £444,780 | -2% |
50 Properties |
| 2015 | £454,000 | -33% |
10 Properties |
| 2014 | £605,000 | 60% |
1 Property |
| 2011 | £243,000 | 3% |
1 Property |
| 2010 | £235,000 | -98% |
1 Property |
| 2005 | £465,000 | 46% |
1 Property |
| 2001 | £250,000 | 52% |
1 Property |
| 1998 | £120,000 | -140% |
1 Property |
| 1997 | £288,000 | 76% |
1 Property |
| 1995 | £70,000 | - |
1 Property |
Property Price per Property Type in Hythe
Here you can find historic sold price data in order to help with your property search.
The average Property Paid Price for specific property types in the last three years are:
| Property Type | Average Sold Price | Sold Properties |
|---|---|---|
| Semi Detached House | £582,500.00 | 2 Semi Detached Houses |
| Flat | £362,634.00 | 23 Flats |
| Detached House | £795,000.00 | 3 Detached Houses |
| Terraced House | £430,333.00 | 3 Terraced Houses |


