
Houses for sale & to rent in Higham, Rochester
House Prices in Higham
Properties in Higham have an average house price of £461,297.00 and had 177 Property Transactions within the last 3 years¹.
Higham is an area in Rochester, Kent with 1,605 households², where the most expensive property was sold for £1,140,000.00.
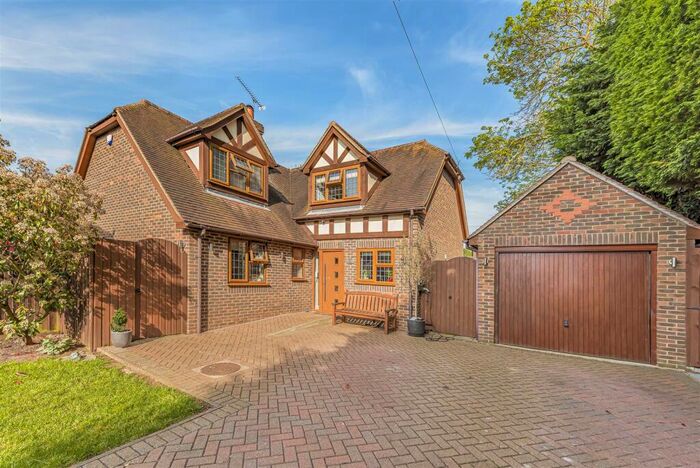
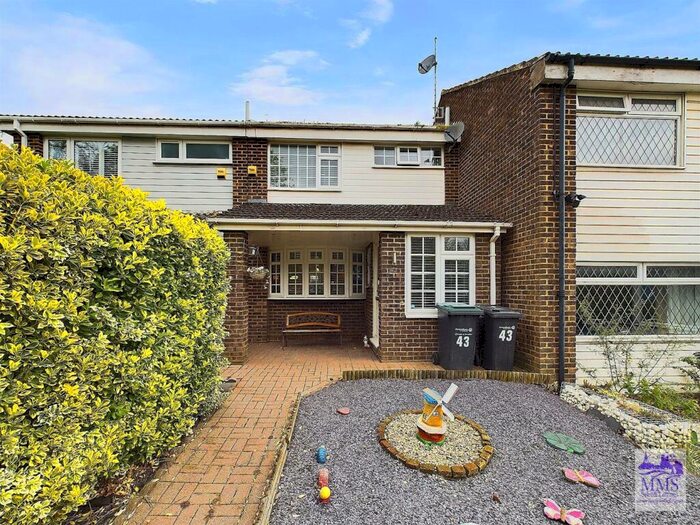
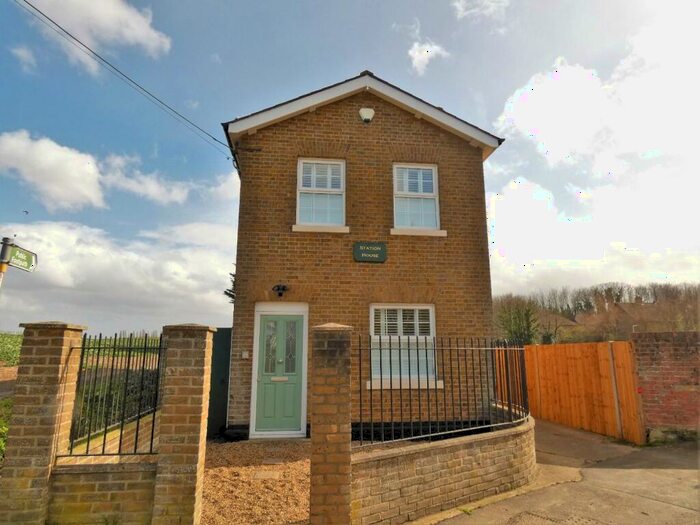
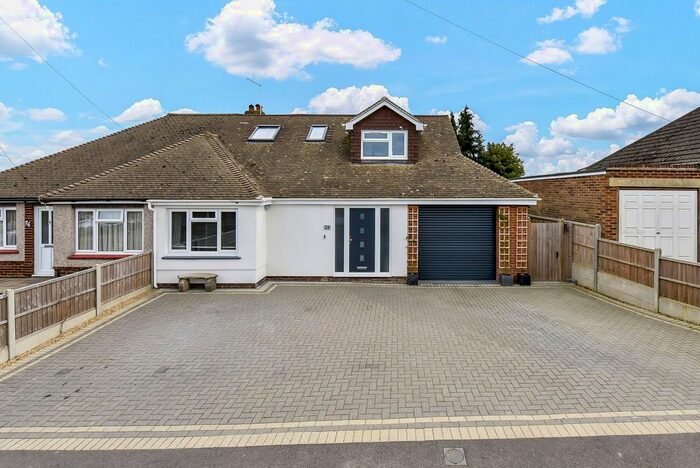
Properties for sale in Higham


Roads and Postcodes in Higham
Navigate through our locations to find the location of your next house in Higham, Rochester for sale or to rent.
| Streets | Postcodes |
|---|---|
| Alexander Cottages | ME3 7JG |
| Ash Crescent | ME3 7BA |
| Beech Grove | ME3 7AZ ME3 7BB |
| Briar Dale | ME3 7EE |
| Brice Road | ME3 7AB ME3 7AG |
| Brookers Place | ME3 7JB |
| Buckland Road | ME3 7HY |
| Bull Lane | ME3 7LT |
| Canal Road | ME3 7HU ME3 7HX ME3 7TS |
| Carton Road | ME3 7EB |
| Chalk Road | ME3 7JY ME3 7LA ME3 7JX |
| Charles Dickens Avenue | ME3 7NL |
| Chequers Court | ME3 7HZ |
| Cherry Garden Cottages | ME3 7HB |
| Chilton Drive | ME3 7BW |
| Church Cottages | ME3 7LR |
| Church Street | ME3 7LB ME3 7LD ME3 7LP ME3 7LS ME3 7LE ME3 7LJ |
| Colewood Drive | ME2 3UE |
| Copperfield Crescent | ME3 7NJ |
| Crutches Lane | ME2 3UH ME3 7DJ |
| Darby Gardens | ME3 7BH |
| Dillywood Lane | ME3 7NT |
| Dombey Close | ME3 7AE |
| Elm Close | ME3 7NH |
| Evergreen Close | ME3 7EL |
| Fairview Drive | ME3 7BG |
| Forge Lane | ME3 7AH ME3 7AJ ME3 7AL ME3 7AS |
| Gads Hill Place | ME3 7DS ME3 7PA |
| Gore Green Road | ME3 7HJ ME3 7HQ ME3 7HL |
| Gravesend Road | ME3 7DP ME3 7DZ ME3 7EQ ME3 7NU ME3 7NX ME3 7NY ME3 7NZ ME3 7DN ME3 7DR |
| Hayes Close | ME3 7AR |
| Hermitage Road | ME3 7DA ME3 7DB ME3 7DD ME3 7ND ME3 7NE ME3 7NF ME3 7PB ME3 7DE ME3 7NB |
| High View | ME3 7HR |
| Highwood Close | ME3 7BQ |
| Hollytree Drive | ME3 7EA ME3 7EG ME3 7ED |
| Hope Terrace | ME3 7LH |
| Irvine Road | ME3 7AA |
| Kent Terrace | ME3 7LF |
| Lake Drive | ME3 7LZ |
| Lillechurch Road | ME3 7HN ME3 7HW |
| Lower Rochester Road | ME3 7HD ME3 7HA |
| Martins Close | ME3 7HE |
| Michele Cottages | ME3 7JZ |
| Mountbatten Avenue | ME3 7HS ME3 7HT |
| Norah Lane | ME3 7EP ME3 7ER ME3 7EW |
| Oak Drive | ME3 7BD ME3 7BE |
| Old Watling Street | ME2 3UF ME2 3UG |
| Ostlers Court | ME3 7AY |
| Peartree Place | ME3 7DU |
| Peggotty Close | ME3 7AD |
| Providence Cottages | ME3 7DL |
| Reynolds Fields | ME3 7LX ME3 7LY |
| Sandhill Lane | ME3 7HH |
| School Lane | ME3 7AT ME3 7BN ME3 7JE ME3 7JF ME3 7JH ME3 7JR ME3 7JL ME3 7JQ |
| St Johns Close | ME3 7BP |
| St Johns Road | ME3 7BY ME3 7BZ |
| Steadman Close | ME3 7JD |
| Taylors Lane | ME3 7AX ME3 7JN ME3 7JP ME3 7JT ME3 7JU ME3 7JW |
| Telegraph Hill | ME3 7NN ME3 7NW |
| The Adelaide | ME3 7LU |
| The Braes | ME3 7NA |
| The Larches | ME3 7NQ |
| Town Road | ME3 8EP |
| Vicarage Row | ME3 7HP |
| Villa Road | ME3 7BS ME3 7BT ME3 7BU ME3 7BX |
| Walmers Avenue | ME3 7EH ME3 7EJ |
| Watling Street | ME2 3UQ ME2 3UA |
| Youens Place | ME3 7DT |
Transport near Higham
-
 Higham Station
 -
Strood Station
-
Cuxton Station
-
Rochester Station
-
Chatham Station
-
Gravesend Station
-
Sole Street Station
-
Gillingham (Kent) Station
-
Halling Station
-
East Tilbury Station
- FAQ
- Price Paid By Year
- Property Type Price
Frequently asked questions about Higham
What is the average price for a property for sale in Higham?
The average price for a property for sale in Higham is £461,297. This amount is 20% higher than the average price in Rochester. There are 793 property listings for sale in Higham.
What streets have the most expensive properties for sale in Higham?
The streets with the most expensive properties for sale in Higham are Elm Close at an average of £870,000, Charles Dickens Avenue at an average of £861,500 and Crutches Lane at an average of £764,000.
What streets have the most affordable properties for sale in Higham?
The streets with the most affordable properties for sale in Higham are Chequers Court at an average of £171,300, Peggotty Close at an average of £190,000 and Vicarage Row at an average of £257,500.
Which train stations are available in or near Higham?
Some of the train stations available in or near Higham are Higham, Strood and Cuxton.
Property Price Paid in Higham by Year
The average sold property price by year was:
| Year | Average Sold Price | Price Change |
Sold Properties
|
|---|---|---|---|
| 2024 | £642,500 | 28% |
2 Properties |
| 2023 | £465,171 | -3% |
32 Properties |
| 2022 | £480,034 | 7% |
53 Properties |
| 2021 | £444,858 | 13% |
90 Properties |
| 2020 | £385,950 | -5% |
40 Properties |
| 2019 | £405,898 | 1% |
41 Properties |
| 2018 | £402,605 | -0,2% |
57 Properties |
| 2017 | £403,344 | 10% |
50 Properties |
| 2016 | £361,650 | 10% |
54 Properties |
| 2015 | £325,876 | 3% |
64 Properties |
| 2014 | £315,591 | 1% |
59 Properties |
| 2013 | £312,841 | 21% |
68 Properties |
| 2012 | £247,213 | -11% |
47 Properties |
| 2011 | £273,262 | -3% |
58 Properties |
| 2010 | £280,726 | -1% |
42 Properties |
| 2009 | £284,889 | 13% |
34 Properties |
| 2008 | £249,130 | -13% |
36 Properties |
| 2007 | £282,306 | 14% |
68 Properties |
| 2006 | £243,919 | -10% |
67 Properties |
| 2005 | £268,910 | 16% |
37 Properties |
| 2004 | £225,295 | 10% |
49 Properties |
| 2003 | £203,160 | 8% |
53 Properties |
| 2002 | £187,074 | 8% |
67 Properties |
| 2001 | £171,550 | 21% |
83 Properties |
| 2000 | £135,796 | 4% |
57 Properties |
| 1999 | £129,891 | 25% |
60 Properties |
| 1998 | £96,984 | -12% |
67 Properties |
| 1997 | £109,046 | 14% |
61 Properties |
| 1996 | £93,866 | 8% |
65 Properties |
| 1995 | £86,522 | - |
53 Properties |
Property Price per Property Type in Higham
Here you can find historic sold price data in order to help with your property search.
The average Property Paid Price for specific property types in the last three years are:
| Property Type | Average Sold Price | Sold Properties |
|---|---|---|
| Semi Detached House | £389,621.00 | 76 Semi Detached Houses |
| Detached House | £633,419.00 | 65 Detached Houses |
| Terraced House | £309,514.00 | 34 Terraced Houses |
| Flat | £171,300.00 | 2 Flats |