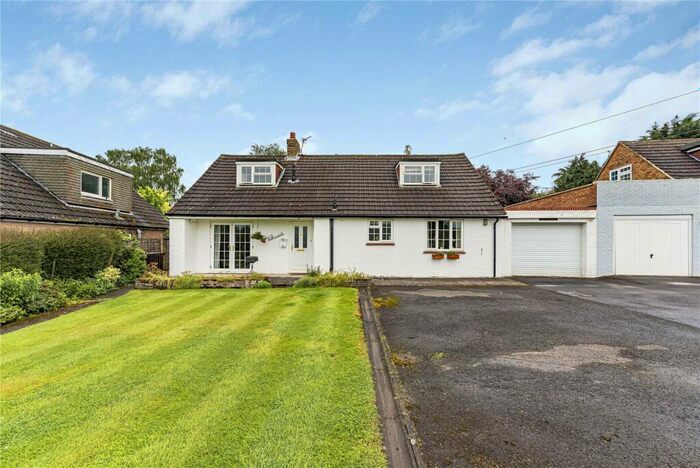
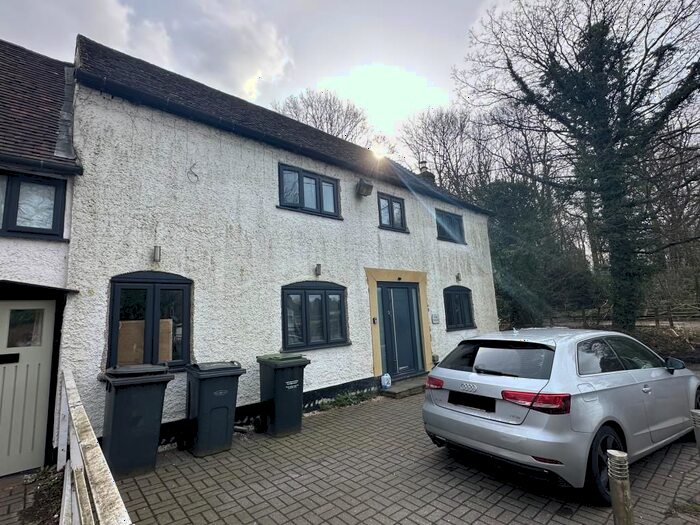
Houses for sale & to rent in Downs, Sevenoaks
House Prices in Downs
Properties in Downs have an average house price of £737,058.00 and had 17 Property Transactions within the last 3 years¹.
Downs is an area in Sevenoaks, Kent with 204 households², where the most expensive property was sold for £1,700,000.00.
Properties for sale in Downs
Roads and Postcodes in Downs
Navigate through our locations to find the location of your next house in Downs, Sevenoaks for sale or to rent.
| Streets | Postcodes |
|---|---|
| Ash Lane | TN15 7DY |
| Bowyers Cottages | TN15 7EB |
| Central Lodge | TN15 7JW |
| Comp Lane | TN15 8QT |
| Ford Lane | TN15 7SD |
| Gravesend Road | TN15 7JL |
| Hatham Green Lane | TN15 7PL |
| Labour In Vain Road | TN15 7NU |
| London Road | TN15 7RU |
| Malthouse Road | TN15 7PH |
| Platt House Lane | TN15 7LX |
| Plaxdale Green Road | TN15 7PB TN15 7PD TN15 7PE |
| Rumney Farm Cottages | TN15 7ER |
| Sandy Lane | TN15 7SB |
| Seven Mile Lane | TN15 8QY TN15 8QZ |
| Tumblefield Road | TN15 7PP TN15 7PR |
| Vigo Road | TN15 7LR TN15 7LU |
| TN15 7LT |
Transport near Downs
- FAQ
- Price Paid By Year
- Property Type Price
Frequently asked questions about Downs
What is the average price for a property for sale in Downs?
The average price for a property for sale in Downs is £737,058. This amount is 5% higher than the average price in Sevenoaks. There are 1,624 property listings for sale in Downs.
What streets have the most expensive properties for sale in Downs?
The streets with the most expensive properties for sale in Downs are Plaxdale Green Road at an average of £1,000,000, Ford Lane at an average of £850,000 and Tumblefield Road at an average of £620,000.
What streets have the most affordable properties for sale in Downs?
The streets with the most affordable properties for sale in Downs are Platt House Lane at an average of £338,000, Comp Lane at an average of £350,000 and Vigo Road at an average of £475,000.
Which train stations are available in or near Downs?
Some of the train stations available in or near Downs are Borough Green and Wrotham, Kemsing and West Malling.
Property Price Paid in Downs by Year
The average sold property price by year was:
| Year | Average Sold Price | Price Change |
Sold Properties
|
|---|---|---|---|
| 2023 | £736,600 | 18% |
5 Properties |
| 2022 | £601,666 | -30% |
3 Properties |
| 2021 | £782,444 | 23% |
9 Properties |
| 2020 | £603,500 | 4% |
5 Properties |
| 2019 | £582,083 | 13% |
6 Properties |
| 2018 | £506,800 | -43% |
5 Properties |
| 2017 | £726,204 | 17% |
9 Properties |
| 2016 | £603,300 | -29% |
10 Properties |
| 2015 | £776,464 | 4% |
14 Properties |
| 2014 | £745,500 | 45% |
6 Properties |
| 2013 | £410,000 | -29% |
1 Property |
| 2012 | £527,000 | -110% |
5 Properties |
| 2011 | £1,107,667 | 28% |
6 Properties |
| 2009 | £798,333 | 32% |
3 Properties |
| 2008 | £541,666 | 19% |
3 Properties |
| 2007 | £440,500 | -27% |
6 Properties |
| 2006 | £560,857 | 9% |
7 Properties |
| 2005 | £510,000 | 28% |
3 Properties |
| 2004 | £368,642 | 3% |
7 Properties |
| 2003 | £358,857 | 14% |
7 Properties |
| 2002 | £307,492 | -50% |
7 Properties |
| 2001 | £461,666 | 26% |
3 Properties |
| 2000 | £341,300 | 45% |
5 Properties |
| 1999 | £187,750 | -45% |
10 Properties |
| 1998 | £272,200 | 35% |
5 Properties |
| 1997 | £177,000 | 21% |
3 Properties |
| 1996 | £139,825 | 8% |
8 Properties |
| 1995 | £128,952 | - |
5 Properties |
Property Price per Property Type in Downs
Here you can find historic sold price data in order to help with your property search.
The average Property Paid Price for specific property types in the last three years are:
| Property Type | Average Sold Price | Sold Properties |
|---|---|---|
| Terraced House | £344,000.00 | 2 Terraced Houses |
| Detached House | £896,416.00 | 12 Detached Houses |
| Semi Detached House | £361,666.00 | 3 Semi Detached Houses |


