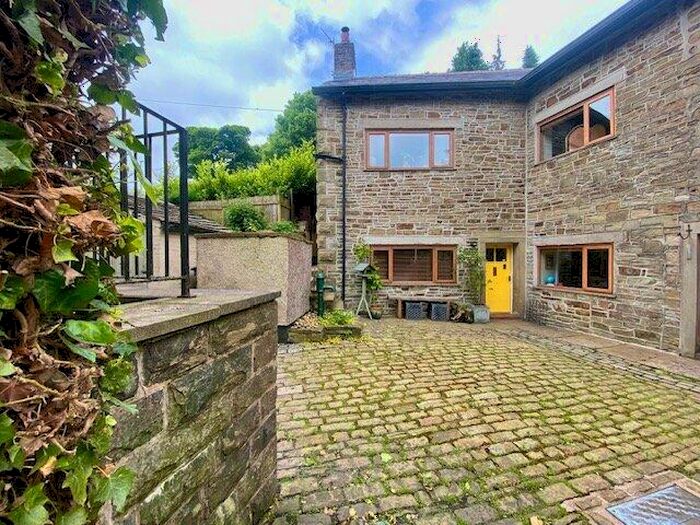
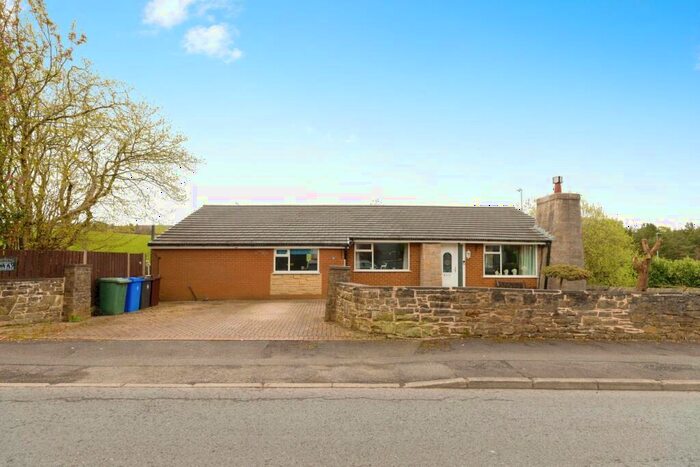
Houses for sale & to rent in Worsley, Accrington
House Prices in Worsley
Properties in Worsley have an average house price of £165,883.00 and had 28 Property Transactions within the last 3 years¹.
Worsley is an area in Accrington, Lancashire with 280 households², where the most expensive property was sold for £500,000.00.
Properties for sale in Worsley
Previously listed properties in Worsley
Roads and Postcodes in Worsley
Navigate through our locations to find the location of your next house in Worsley, Accrington for sale or to rent.
| Streets | Postcodes |
|---|---|
| Belgrave Street | BB5 2SE |
| Blackburn Road | BB5 2RY BB5 2SB BB5 2AJ BB5 2AL BB5 2SA |
| East View | BB5 2SH |
| Goodshaw Lane | BB5 2DW |
| Hazel Street | BB5 2SG |
| Hoyle Street | BB5 2SD |
| Kings Highway | BB5 2DL BB5 2DN |
| Lower Mill Cottages | BB5 2SQ |
| Lower Stone Fold | BB5 2DR |
| Northfield Road | BB5 2DY BB5 2SR |
| Oak Avenue | BB5 2SP |
| Rising Bridge Road | BB5 2SN BB5 2SW |
| Roundhill View | BB5 2SS |
| Sherfin | BB5 2DS BB5 2DX |
| Sherfin Nook | BB5 2DT |
| Stone Fold Village | BB5 2DP |
| The Close | BB5 2ST |
| Underbank Road | BB5 2TA |
| Worsley Street | BB5 2SJ BB5 2SL |
| BB5 2DU |
Transport near Worsley
-
Accrington Station
-
Church and Oswaldtwistle Station
-
Huncoat Station
-
Hapton Station
-
Rose Grove Station
-
Rishton Station
- FAQ
- Price Paid By Year
- Property Type Price
Frequently asked questions about Worsley
What is the average price for a property for sale in Worsley?
The average price for a property for sale in Worsley is £165,883. This amount is 24% higher than the average price in Accrington. There are 158 property listings for sale in Worsley.
What streets have the most expensive properties for sale in Worsley?
The streets with the most expensive properties for sale in Worsley are Sherfin at an average of £335,000, Hazel Street at an average of £245,000 and Blackburn Road at an average of £161,875.
What streets have the most affordable properties for sale in Worsley?
The streets with the most affordable properties for sale in Worsley are Belgrave Street at an average of £109,875, Hoyle Street at an average of £111,083 and Roundhill View at an average of £133,500.
Which train stations are available in or near Worsley?
Some of the train stations available in or near Worsley are Accrington, Church and Oswaldtwistle and Huncoat.
Property Price Paid in Worsley by Year
The average sold property price by year was:
| Year | Average Sold Price | Price Change |
Sold Properties
|
|---|---|---|---|
| 2023 | £140,681 | -48% |
11 Properties |
| 2022 | £207,666 | 26% |
9 Properties |
| 2021 | £153,531 | -10% |
8 Properties |
| 2020 | £168,843 | 37% |
8 Properties |
| 2019 | £106,273 | -6% |
15 Properties |
| 2018 | £112,750 | 9% |
14 Properties |
| 2017 | £102,450 | -19% |
15 Properties |
| 2016 | £122,068 | 32% |
11 Properties |
| 2015 | £83,400 | -62% |
12 Properties |
| 2014 | £135,352 | 44% |
16 Properties |
| 2013 | £75,638 | 16% |
9 Properties |
| 2012 | £63,750 | -68% |
4 Properties |
| 2011 | £107,166 | 10% |
6 Properties |
| 2010 | £96,500 | 12% |
3 Properties |
| 2009 | £85,200 | -52% |
5 Properties |
| 2008 | £129,557 | 25% |
12 Properties |
| 2007 | £97,577 | 5% |
16 Properties |
| 2006 | £92,782 | -29% |
14 Properties |
| 2005 | £119,733 | 43% |
20 Properties |
| 2004 | £67,753 | 8% |
13 Properties |
| 2003 | £62,528 | 27% |
14 Properties |
| 2002 | £45,801 | 35% |
15 Properties |
| 2001 | £29,623 | -47% |
11 Properties |
| 2000 | £43,428 | -17% |
14 Properties |
| 1999 | £50,726 | 17% |
13 Properties |
| 1998 | £41,940 | 29% |
11 Properties |
| 1997 | £29,645 | 2% |
10 Properties |
| 1996 | £29,021 | 3% |
8 Properties |
| 1995 | £28,243 | - |
8 Properties |
Property Price per Property Type in Worsley
Here you can find historic sold price data in order to help with your property search.
The average Property Paid Price for specific property types in the last three years are:
| Property Type | Average Sold Price | Sold Properties |
|---|---|---|
| Semi Detached House | £186,333.00 | 3 Semi Detached Houses |
| Terraced House | £140,902.00 | 23 Terraced Houses |
| Detached House | £422,500.00 | 2 Detached Houses |


