
Houses for sale & to rent in Hillsides, Grantham
House Prices in Hillsides
Properties in Hillsides have an average house price of £325,409.00 and had 11 Property Transactions within the last 3 years¹.
Hillsides is an area in Grantham, Lincolnshire with 144 households², where the most expensive property was sold for £1,042,000.00.
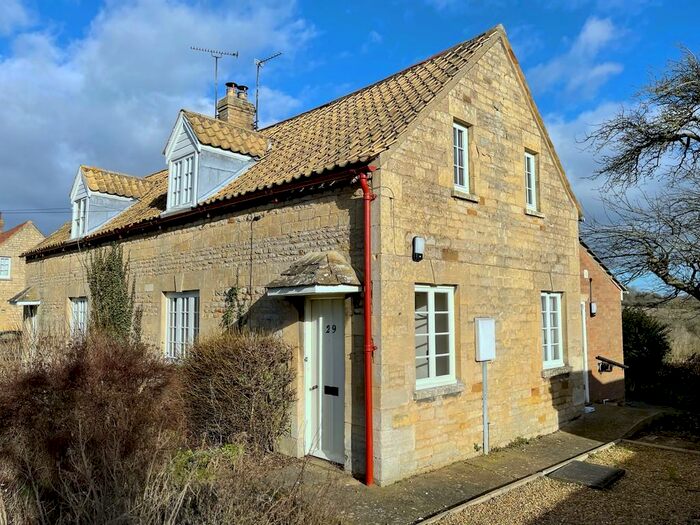
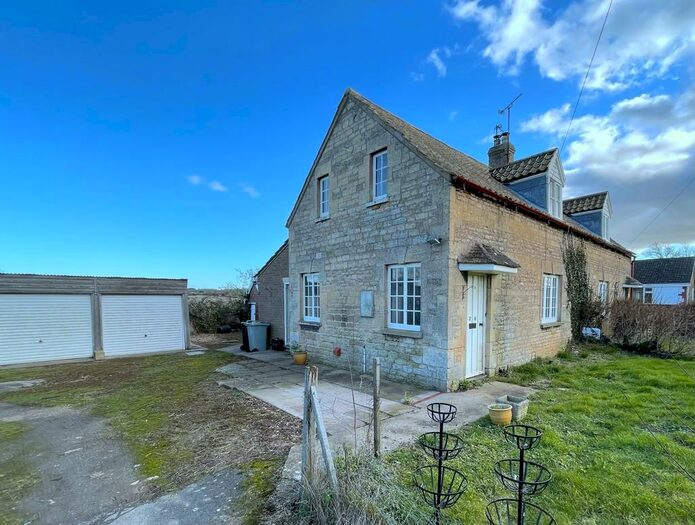
Properties for sale in Hillsides


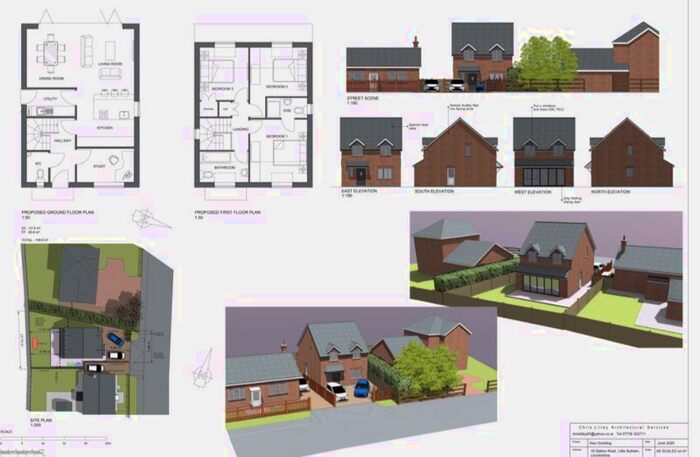
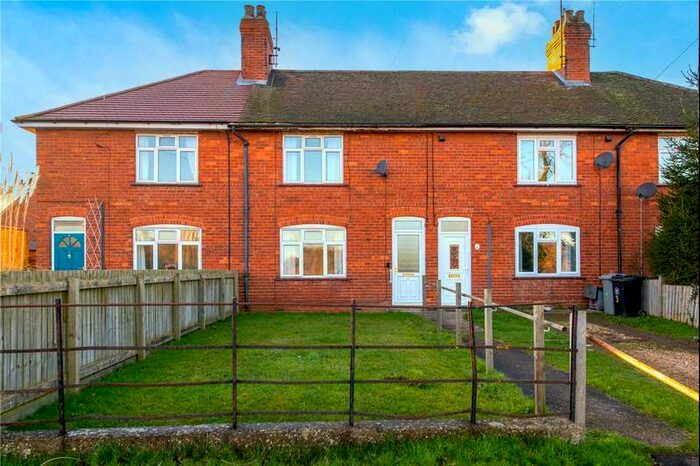
Previously listed properties in Hillsides


Roads and Postcodes in Hillsides
Navigate through our locations to find the location of your next house in Hillsides, Grantham for sale or to rent.
| Streets | Postcodes |
|---|---|
| Bytham Road | NG33 4PY |
| Church Lane | NG33 4QP |
| Creeton Road | NG33 4PR NG33 4PT NG33 4PU NG33 4PX |
| Glen Close | NG33 4PS |
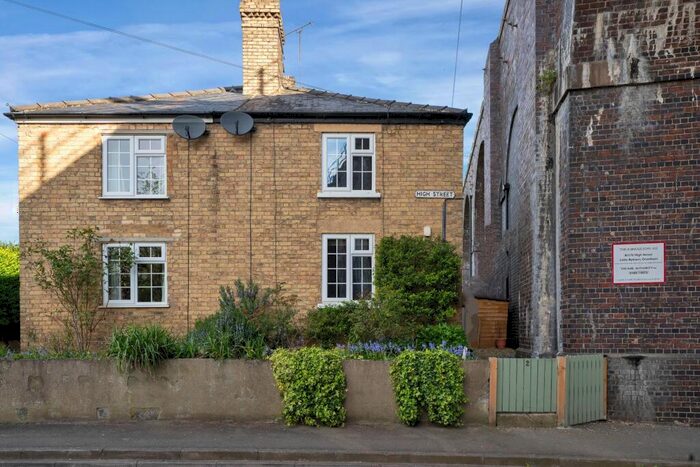
| High Street | NG33 4PP NG33 4QJ NG33 4QX |
| New Estate | NG33 4QL |
| Sheepdyke Lane | NG33 4QZ |
| St Medards Close | NG33 4RX |
| Station Road | NG33 4QY NG33 4RA |
| NG33 4QD NG33 4QF |
Transport near Hillsides

- FAQ
- Price Paid By Year
- Property Type Price
Frequently asked questions about Hillsides
What is the average price for a property for sale in Hillsides?
The average price for a property for sale in Hillsides is £325,409. This amount is 29% higher than the average price in Grantham. There are 33 property listings for sale in Hillsides.
What streets have the most expensive properties for sale in Hillsides?
The streets with the most expensive properties for sale in Hillsides are High Street at an average of £311,666 and New Estate at an average of £265,000.
What streets have the most affordable properties for sale in Hillsides?
The streets with the most affordable properties for sale in Hillsides are Bytham Road at an average of £145,000 and Station Road at an average of £262,500.
Which train stations are available in or near Hillsides?
Some of the train stations available in or near Hillsides are Stamford, Oakham and Grantham.
Property Price Paid in Hillsides by Year
The average sold property price by year was:
| Year | Average Sold Price | Price Change |
Sold Properties
|
|---|---|---|---|
| 2023 | £250,000 | -14% |
3 Properties |
| 2022 | £285,000 | -48% |
4 Properties |
| 2021 | £422,375 | 13% |
4 Properties |
| 2020 | £368,666 | 19% |
3 Properties |
| 2019 | £297,666 | 48% |
3 Properties |
| 2018 | £155,000 | -84% |
2 Properties |
| 2017 | £285,493 | 20% |
8 Properties |
| 2016 | £228,222 | -39% |
9 Properties |
| 2015 | £317,658 | 7% |
6 Properties |
| 2014 | £294,800 | -2% |
5 Properties |
| 2013 | £299,428 | 60% |
7 Properties |
| 2012 | £121,250 | -357% |
6 Properties |
| 2011 | £553,750 | 84% |
4 Properties |
| 2010 | £90,000 | -28% |
1 Property |
| 2009 | £115,000 | -148% |
1 Property |
| 2008 | £285,500 | -12% |
4 Properties |
| 2007 | £320,000 | 14% |
1 Property |
| 2006 | £275,454 | 28% |
11 Properties |
| 2005 | £197,500 | -55% |
3 Properties |
| 2004 | £305,680 | 1% |
8 Properties |
| 2003 | £303,360 | 54% |
5 Properties |
| 2002 | £139,213 | -38% |
11 Properties |
| 2001 | £191,915 | 34% |
6 Properties |
| 2000 | £126,491 | -34% |
6 Properties |
| 1999 | £169,000 | 56% |
5 Properties |
| 1998 | £75,000 | -37% |
3 Properties |
| 1997 | £102,833 | 20% |
6 Properties |
| 1996 | £82,125 | -13% |
8 Properties |
| 1995 | £92,862 | - |
4 Properties |
Property Price per Property Type in Hillsides
Here you can find historic sold price data in order to help with your property search.
The average Property Paid Price for specific property types in the last three years are:
| Property Type | Average Sold Price | Sold Properties |
|---|---|---|
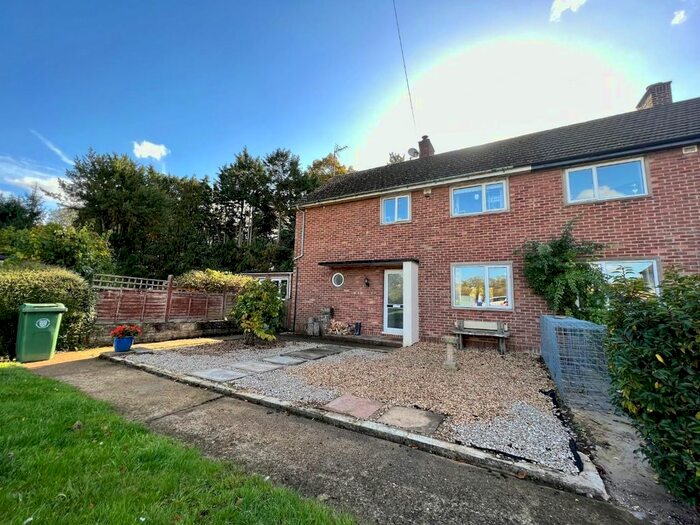
| Semi Detached House | £249,375.00 | 4 Semi Detached Houses |
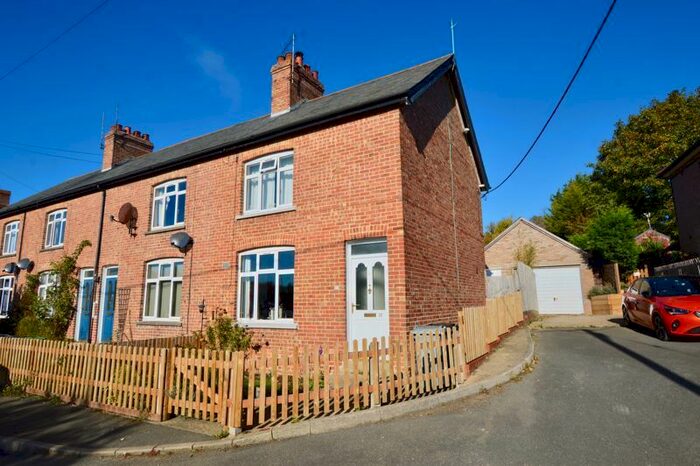
| Terraced House | £235,000.00 | 3 Terraced Houses |
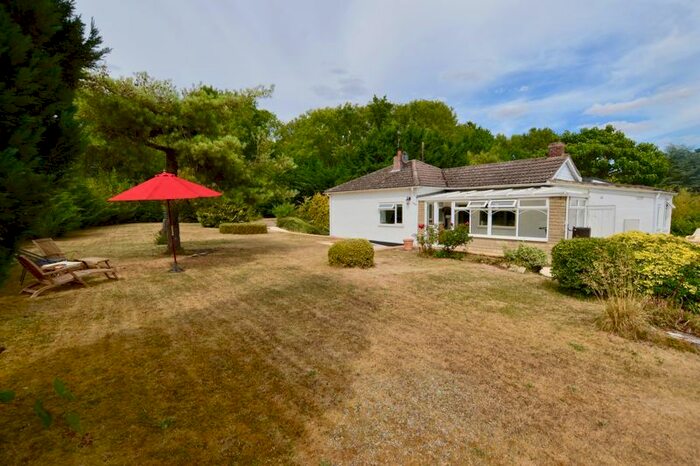
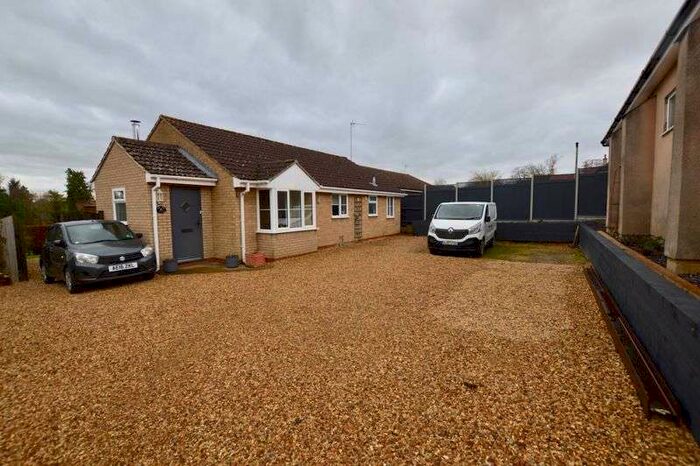
| Detached House | £469,250.00 | 4 Detached Houses |