
Houses for sale & to rent in Skipton, North Yorkshire
House Prices in Skipton
Properties in Skipton have an average house price of £302,642.00 and had 1,595 Property Transactions within the last 3 years.¹
Skipton is an area in North Yorkshire with 13,058 households², where the most expensive property was sold for £2,025,000.00.
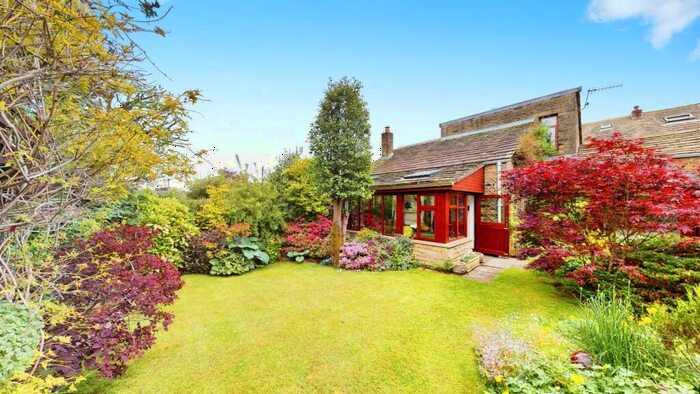
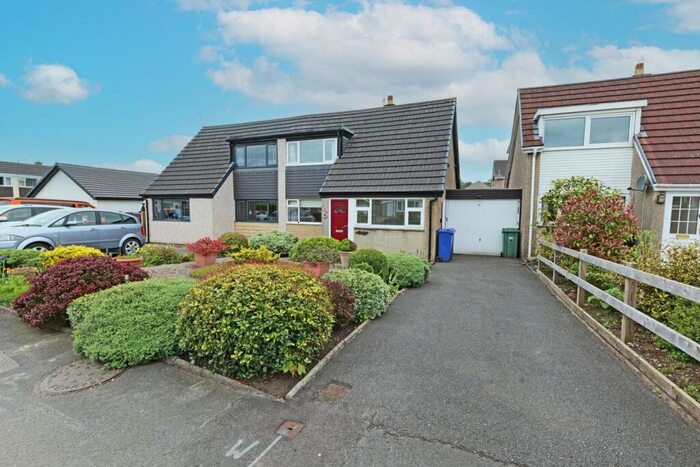
Properties for sale in Skipton


Neighbourhoods in Skipton
Navigate through our locations to find the location of your next house in Skipton, North Yorkshire for sale or to rent.
- Barden Fell
- Embsay-with-eastby
- Gargrave And Malhamdale
- Grassington
- Hellifield And Long Preston
- Settle And Ribblebanks
- Skipton East
- Skipton North
- Skipton South
- Skipton West
- Upper Wharfedale
- West Craven
- Skipton North & Embsay-with-eastby
- Skipton East & South
- Skipton West & West Craven
- Aire Valley
- Mid Craven
- Settle & Penyghent
- Wharfedale
Transport in Skipton
Please see below transportation links in this area:
-
 Gargrave Station
 -
Skipton Station
-
Cononley Station
-
Hellifield Station
-
Steeton and Silsden Station
-
Long Preston Station
- FAQ
- Price Paid By Year
- Property Type Price
Frequently asked questions about Skipton
What is the average price for a property for sale in Skipton?
The average price for a property for sale in Skipton is £302,642. This amount is 1% lower than the average price in North Yorkshire. There are more than 10,000 property listings for sale in Skipton.
What locations have the most expensive properties for sale in Skipton?
The locations with the most expensive properties for sale in Skipton are Barden Fell at an average of £579,583, Grassington at an average of £444,759 and Upper Wharfedale at an average of £411,814.
What locations have the most affordable properties for sale in Skipton?
The locations with the most affordable properties for sale in Skipton are Skipton South at an average of £179,399, Skipton West at an average of £189,501 and Skipton East at an average of £264,492.
Which train stations are available in or near Skipton?
Some of the train stations available in or near Skipton are Gargrave, Skipton and Cononley.
Property Price Paid in Skipton by Year
The average sold property price by year was:
| Year | Average Sold Price | Price Change |
Sold Properties
|
|---|---|---|---|
| 2024 | £298,636 | -4% |
40 Properties |
| 2023 | £310,871 | -3% |
390 Properties |
| 2022 | £320,842 | 11% |
501 Properties |
| 2021 | £284,318 | -0,5% |
664 Properties |
| 2020 | £285,635 | 5% |
567 Properties |
| 2019 | £271,438 | 12% |
574 Properties |
| 2018 | £239,153 | -3% |
617 Properties |
| 2017 | £246,300 | 4% |
614 Properties |
| 2016 | £236,017 | 6% |
600 Properties |
| 2015 | £221,173 | 1% |
622 Properties |
| 2014 | £218,875 | 6% |
576 Properties |
| 2013 | £205,781 | -8% |
482 Properties |
| 2012 | £222,183 | 7% |
433 Properties |
| 2011 | £206,901 | -8% |
417 Properties |
| 2010 | £223,565 | 16% |
384 Properties |
| 2009 | £188,132 | -18% |
393 Properties |
| 2008 | £221,078 | -2% |
382 Properties |
| 2007 | £224,723 | 4% |
582 Properties |
| 2006 | £215,247 | 8% |
724 Properties |
| 2005 | £198,367 | 7% |
655 Properties |
| 2004 | £183,509 | 14% |
683 Properties |
| 2003 | £157,205 | 17% |
719 Properties |
| 2002 | £129,757 | 22% |
751 Properties |
| 2001 | £100,984 | 9% |
696 Properties |
| 2000 | £91,860 | 5% |
676 Properties |
| 1999 | £87,027 | 2% |
662 Properties |
| 1998 | £85,692 | 8% |
519 Properties |
| 1997 | £78,415 | 9% |
614 Properties |
| 1996 | £71,053 | 5% |
598 Properties |
| 1995 | £67,701 | - |
486 Properties |
Property Price per Property Type in Skipton
Here you can find historic sold price data in order to help with your property search.
The average Property Paid Price for specific property types in the last three years are:
| Property Type | Average Sold Price | Sold Properties |
|---|---|---|
| Terraced House | £219,634.00 | 695 Terraced Houses |
| Flat | £188,834.00 | 177 Flats |
| Semi Detached House | £314,861.00 | 426 Semi Detached Houses |
| Detached House | £547,187.00 | 297 Detached Houses |