
Houses for sale & to rent in Doncaster, Nottinghamshire
House Prices in Doncaster
Properties in Doncaster have an average house price of £230,820.00 and had 875 Property Transactions within the last 3 years.¹
Doncaster is an area in Nottinghamshire with 6,881 households², where the most expensive property was sold for £1,175,000.00.
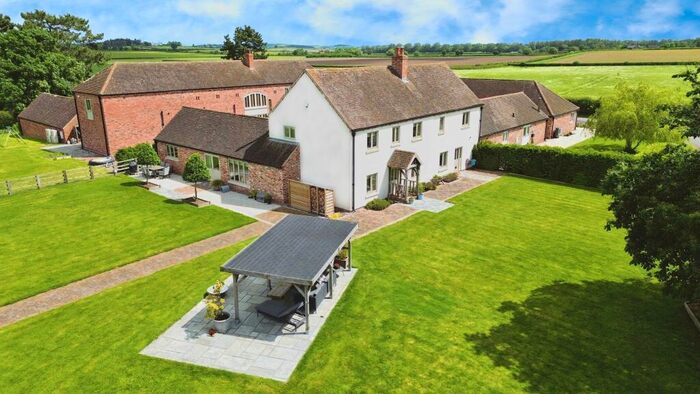
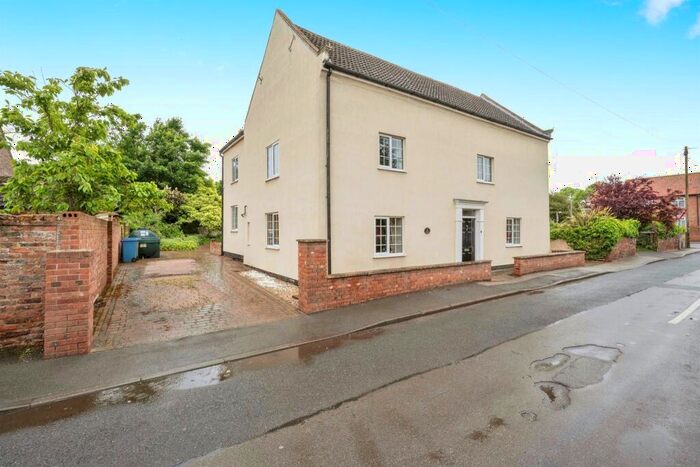
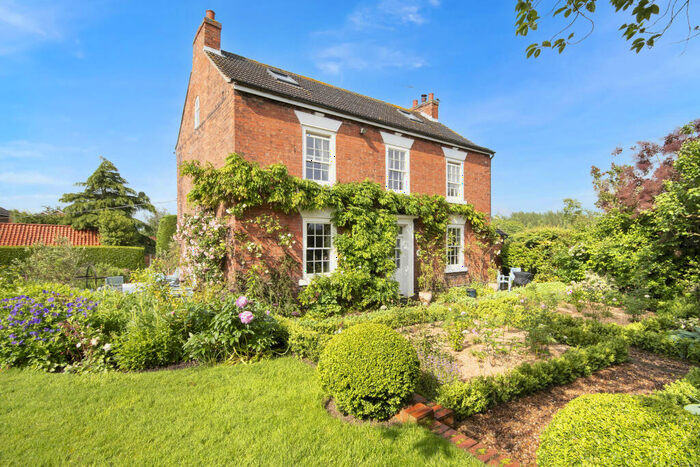
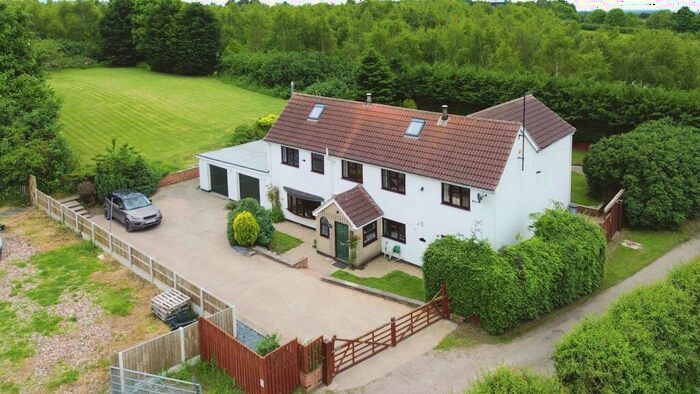
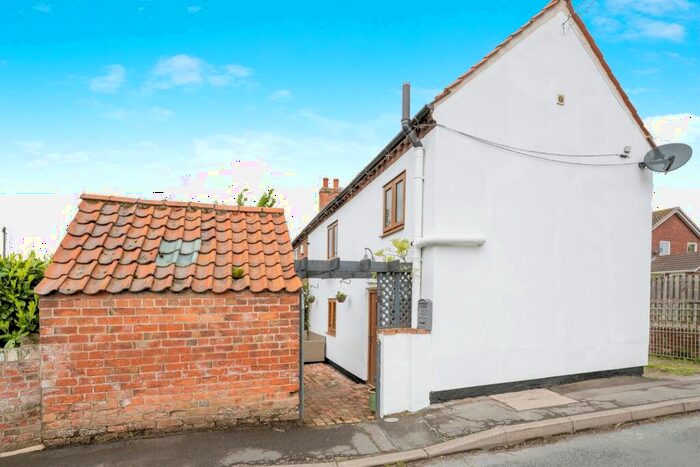
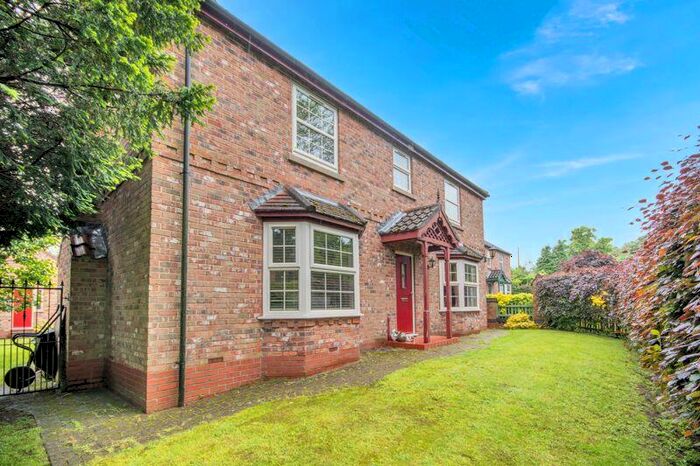
Properties for sale in Doncaster


Neighbourhoods in Doncaster
Navigate through our locations to find the location of your next house in Doncaster, Nottinghamshire for sale or to rent.
Transport in Doncaster
Please see below transportation links in this area:

- FAQ
- Price Paid By Year
- Property Type Price
Frequently asked questions about Doncaster
What is the average price for a property for sale in Doncaster?
The average price for a property for sale in Doncaster is £230,820. This amount is 6% lower than the average price in Nottinghamshire. There are 7,220 property listings for sale in Doncaster.
What locations have the most expensive properties for sale in Doncaster?
The locations with the most expensive properties for sale in Doncaster are Clayworth at an average of £393,100, Ranskill at an average of £347,723 and Everton at an average of £344,249.
What locations have the most affordable properties for sale in Doncaster?
The locations with the most affordable properties for sale in Doncaster are Harworth at an average of £174,009, Misterton at an average of £258,689 and Blyth at an average of £263,930.
Which train stations are available in or near Doncaster?
Some of the train stations available in or near Doncaster are Retford, Gainsborough Central and Gainsborough Lea Road.
Property Price Paid in Doncaster by Year
The average sold property price by year was:
| Year | Average Sold Price | Price Change |
Sold Properties
|
|---|---|---|---|
| 2024 | £272,300 | 18% |
15 Properties |
| 2023 | £224,576 | -3% |
197 Properties |
| 2022 | £230,638 | -1% |
305 Properties |
| 2021 | £232,675 | 12% |
358 Properties |
| 2020 | £204,136 | 12% |
344 Properties |
| 2019 | £178,851 | 4% |
419 Properties |
| 2018 | £171,685 | 3% |
341 Properties |
| 2017 | £166,325 | -1% |
379 Properties |
| 2016 | £168,803 | 1% |
368 Properties |
| 2015 | £167,045 | 0,4% |
301 Properties |
| 2014 | £166,366 | 9% |
249 Properties |
| 2013 | £152,203 | 1% |
183 Properties |
| 2012 | £150,218 | -1% |
169 Properties |
| 2011 | £151,958 | 2% |
153 Properties |
| 2010 | £148,819 | 1% |
172 Properties |
| 2009 | £147,528 | -6% |
161 Properties |
| 2008 | £156,403 | -5% |
168 Properties |
| 2007 | £163,593 | 3% |
344 Properties |
| 2006 | £159,482 | 6% |
398 Properties |
| 2005 | £150,600 | 15% |
234 Properties |
| 2004 | £127,821 | 13% |
270 Properties |
| 2003 | £111,425 | 22% |
299 Properties |
| 2002 | £86,876 | 19% |
327 Properties |
| 2001 | £70,728 | -2% |
336 Properties |
| 2000 | £72,240 | 11% |
255 Properties |
| 1999 | £64,649 | 10% |
238 Properties |
| 1998 | £58,198 | 8% |
222 Properties |
| 1997 | £53,649 | 7% |
245 Properties |
| 1996 | £49,942 | -1% |
210 Properties |
| 1995 | £50,520 | - |
201 Properties |
Property Price per Property Type in Doncaster
Here you can find historic sold price data in order to help with your property search.
The average Property Paid Price for specific property types in the last three years are:
| Property Type | Average Sold Price | Sold Properties |
|---|---|---|
| Semi Detached House | £167,382.00 | 324 Semi Detached Houses |
| Terraced House | £145,121.00 | 153 Terraced Houses |
| Detached House | £320,879.00 | 388 Detached Houses |
| Flat | £103,150.00 | 10 Flats |