
Houses for sale & to rent in Blackfriars & Trinity, Salford
House Prices in Blackfriars & Trinity
Properties in Blackfriars & Trinity have an average house price of £249,161.00 and had 156 Property Transactions within the last 3 years¹.
Blackfriars & Trinity is an area in Salford, Salford with 437 households², where the most expensive property was sold for £2,100,000.00.
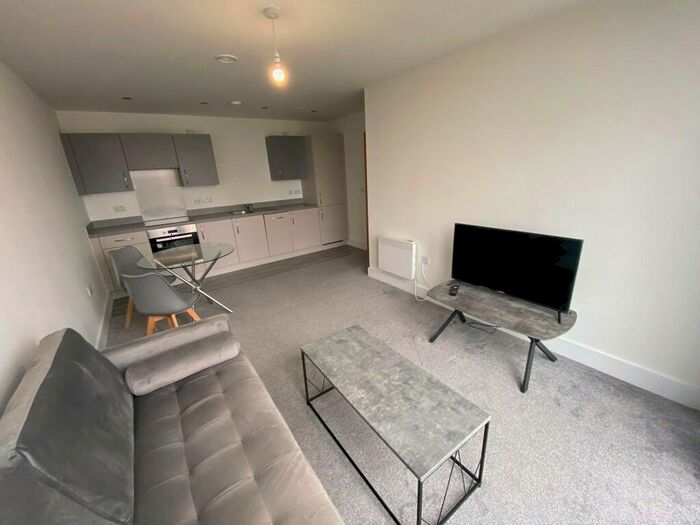
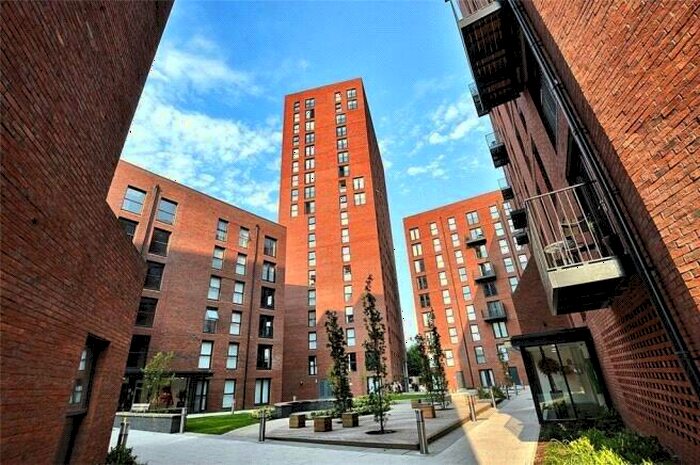
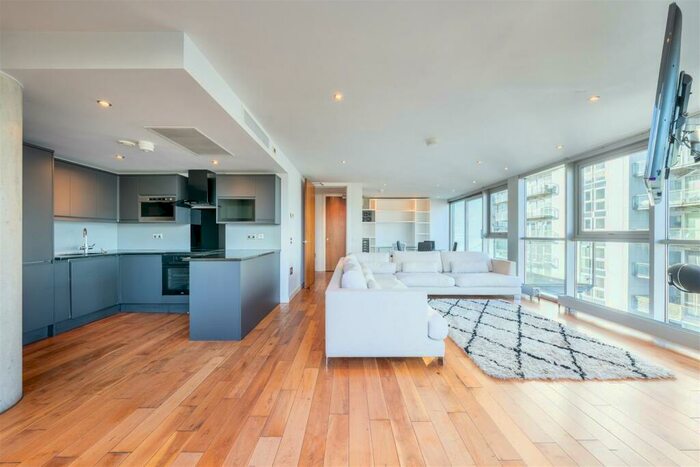
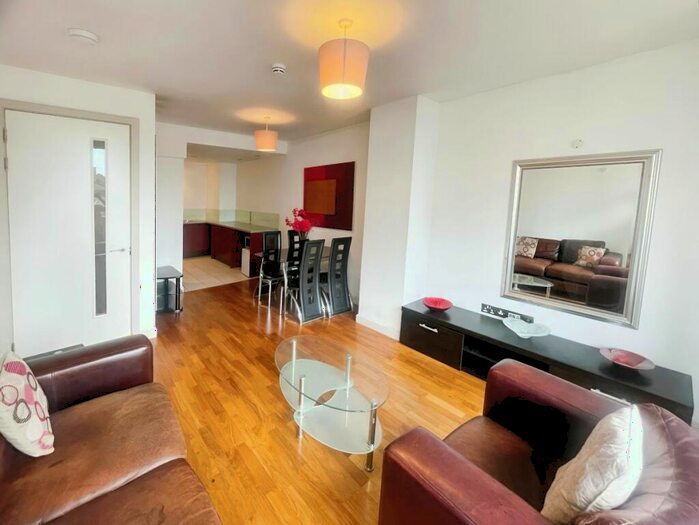
Properties for sale in Blackfriars & Trinity


Roads and Postcodes in Blackfriars & Trinity
Navigate through our locations to find the location of your next house in Blackfriars & Trinity, Salford for sale or to rent.
| Streets | Postcodes |
|---|---|
| Adelphi Street | M3 6DN M3 6DZ M3 6EN M3 6FZ M3 6GG M3 6GH M3 6JN M3 6JP |
| Allen Dale Walk | M3 6FF |
| Barlow's Croft | M3 5DY |
| Bexley Square | M3 6GP |
| Blackburn Street | M3 6FY |
| Blackfriars Road | M3 7AG M3 7AQ M3 7AT M3 7BZ M3 7EA M3 7FU |
| Blackfriars Street | M3 5AL M3 5BQ |
| Bloom Street | M3 6AN M3 6DF |
| Booth Street | M3 5DE M3 5DG |
| Bridgewater Street | M3 7LD |
| Briggs Street | M3 6NH |
| Bury Street | M3 7FL M3 7FW M3 7GA M3 7GB |
| Cannon Street | M3 6EG M3 6FD M3 6FE M3 6JH M3 6NB M3 6WA M3 6WB M3 7EU |
| Carding Grove | M3 7NY |
| Cathedral Approach | M3 7FB |
| Caxton Street | M3 5AZ |
| Change Way | M3 7RB |
| Chapel Street | M3 5BZ M3 5DF M3 5DW M3 5DZ M3 5JZ M3 5LE M3 5LL M3 6AD M3 6BY M3 7AA M3 7BA M3 7NH M3 7WJ |
| Cleminson Street | M3 6DU M3 6EA |
| Clowes Street | M3 5NH |
| Collier Street | M3 7DW |
| Cross Street | M3 7EX M3 7AX |
| Crown Street | M3 7DH |
| Damask Avenue | M3 6EE |
| Dearmans Place | M3 5AQ M3 5BA M3 5BB M3 5BD M3 5BE M3 5BF M3 5BG M3 5BH M3 5BJ M3 5BN M3 5BS M3 5BW M3 5BX M3 5DS M3 5DT M3 5DU M3 5DX M3 5LH M3 5EZ M3 5FA M3 5FB M3 5FE M3 5FF M3 5FG M3 5FH M3 5FL M3 5FN M3 5FW |
| Deva City Office Park | M3 7BB M3 7BD M3 7BF M3 7BG |
| Devine Close | M3 6FS |
| Dun Close | M3 6FN |
| East Philip Street | M3 7LE |
| Ford Street | M3 6DP |
| Garden Lane | M3 7FJ |
| Gravel Lane | M3 7WH |
| Great George Street | M3 6EH |
| Greengate | M3 7HQ M3 7HR M3 7HS M3 7HT M3 7HU M3 7FA M3 7NA M3 7NL |
| King Street | M3 7BN M3 7DG |
| Mayan Avenue | M3 6BP |
| Mount Street | M3 6LU |
| New Bailey Street | M3 5AG M3 5AJ M3 5AP M3 5EU M3 5FS M3 5GN M3 5GP M3 5GQ M3 5GR |
| New Bridge Street | M3 1NQ M3 1AA |
| New Kings Head Yard | M3 7GF M3 7GG M3 7GH M3 7GJ M3 7GL M3 7GN M3 7GP M3 7AE |
| North George Street | M3 6FP M3 6HT M3 6HU |
| Norton Street | M3 7NW |
| Peru Street | M3 6EQ |
| Quay Street | M3 5FZ M3 5GD M3 5GE M3 5GF |
| Queen Street | M3 7DQ |
| Richmond Street | M3 7FY |
| Sandywell Lane | M3 7FF |
| Senior Lane | M3 7FE |
| Silk Street | M3 6LZ |
| Sillavan Way | M3 6GD M3 6GE M3 6GF |
| Springfield Lane | M3 7FH M3 7JQ |
| St Philips Place | M3 6FA |
| St Philips Square | M3 6FB |
| St Simon Street | M3 7FD M3 7FR M3 7FQ |
| St Stephen Street | M3 7HJ M3 6AY |
| Trinity Way | M3 7FT M3 7FX |
| Viaduct Street | M3 7WX |
| Wilton Place | M3 6FR |
| Yorkshire Street | M3 5EG |
| M3 7AB |
Transport near Blackfriars & Trinity
-
 Salford Central Station
 -
Manchester Victoria Station
-
Deansgate Station
-
Salford Crescent Station
-
Manchester Oxford Road Station
-
Manchester Piccadilly Station
-
Ardwick Station
-
Manchester United Football Ground Station
-
Ashburys Station
- FAQ
- Price Paid By Year
- Property Type Price
Frequently asked questions about Blackfriars & Trinity
What is the average price for a property for sale in Blackfriars & Trinity?
The average price for a property for sale in Blackfriars & Trinity is £249,161. This amount is 16% higher than the average price in Salford. There are more than 10,000 property listings for sale in Blackfriars & Trinity.
What streets have the most expensive properties for sale in Blackfriars & Trinity?
The streets with the most expensive properties for sale in Blackfriars & Trinity are Senior Lane at an average of £454,333, Sandywell Lane at an average of £432,500 and St Philips Square at an average of £392,900.
What streets have the most affordable properties for sale in Blackfriars & Trinity?
The streets with the most affordable properties for sale in Blackfriars & Trinity are Bexley Square at an average of £53,000, Bridgewater Street at an average of £115,500 and Adelphi Street at an average of £157,389.
Which train stations are available in or near Blackfriars & Trinity?
Some of the train stations available in or near Blackfriars & Trinity are Salford Central, Manchester Victoria and Deansgate.
Property Price Paid in Blackfriars & Trinity by Year
The average sold property price by year was:
| Year | Average Sold Price | Price Change |
Sold Properties
|
|---|---|---|---|
| 2024 | £202,000 | -11% |
8 Properties |
| 2023 | £223,519 | -26% |
32 Properties |
| 2022 | £282,298 | 16% |
58 Properties |
| 2021 | £236,678 | -20% |
58 Properties |
| 2020 | £282,893 | 17% |
186 Properties |
| 2019 | £234,179 | -27% |
327 Properties |
| 2018 | £297,128 | 10% |
84 Properties |
| 2017 | £267,566 | 29% |
162 Properties |
| 2016 | £191,077 | 23% |
475 Properties |
| 2015 | £146,859 | 63% |
315 Properties |
| 2014 | £53,750 | -468% |
11 Properties |
| 2010 | £305,336 | -47% |
1 Property |
| 2006 | £450,000 | 53% |
1 Property |
| 2004 | £212,500 | -153% |
1 Property |
| 2002 | £537,134 | 71% |
2 Properties |
| 2001 | £155,000 | 43% |
1 Property |
| 1999 | £88,749 | 15% |
2 Properties |
| 1998 | £75,000 | - |
1 Property |
Property Price per Property Type in Blackfriars & Trinity
Here you can find historic sold price data in order to help with your property search.
The average Property Paid Price for specific property types in the last three years are:
| Property Type | Average Sold Price | Sold Properties |
|---|---|---|
| Terraced House | £385,333.00 | 27 Terraced Houses |
| Flat | £220,660.00 | 129 Flats |