
Houses for sale & to rent in Birmingham, Sandwell
House Prices in Birmingham
Properties in Birmingham have an average house price of £241,161.00 and had 822 Property Transactions within the last 3 years.¹
Birmingham is an area in Sandwell with 8,040 households², where the most expensive property was sold for £1,000,000.00.
Properties for sale in Birmingham


Neighbourhoods in Birmingham
Navigate through our locations to find the location of your next house in Birmingham, Sandwell for sale or to rent.
Transport in Birmingham
Please see below transportation links in this area:
-
 Hamstead Station
 -
Tame Bridge Parkway Station
-
Perry Barr Station
-
Bescot Stadium Station
-
The Hawthorns Station
- FAQ
- Price Paid By Year
- Property Type Price
Frequently asked questions about Birmingham
What is the average price for a property for sale in Birmingham?
The average price for a property for sale in Birmingham is £241,161. This amount is 24% higher than the average price in Sandwell. There are 8,708 property listings for sale in Birmingham.
What locations have the most expensive properties for sale in Birmingham?
The locations with the most expensive properties for sale in Birmingham are Charlemont With Grove Vale at an average of £344,569 and Great Barr With Yew Tree at an average of £260,726.
What locations have the most affordable properties for sale in Birmingham?
The locations with the most affordable properties for sale in Birmingham are Soho And Victoria at an average of £189,294 and Newton at an average of £210,145.
Which train stations are available in or near Birmingham?
Some of the train stations available in or near Birmingham are Hamstead, Tame Bridge Parkway and Perry Barr.
Property Price Paid in Birmingham by Year
The average sold property price by year was:
| Year | Average Sold Price | Price Change |
Sold Properties
|
|---|---|---|---|
| 2024 | £222,653 | -11% |
13 Properties |
| 2023 | £247,003 | -3% |
195 Properties |
| 2022 | £253,734 | 10% |
272 Properties |
| 2021 | £228,533 | 13% |
342 Properties |
| 2020 | £199,650 | 1% |
212 Properties |
| 2019 | £196,851 | -0,2% |
312 Properties |
| 2018 | £197,281 | 6% |
287 Properties |
| 2017 | £184,655 | 9% |
291 Properties |
| 2016 | £168,738 | -2% |
275 Properties |
| 2015 | £172,117 | 4% |
294 Properties |
| 2014 | £164,388 | 5% |
237 Properties |
| 2013 | £155,528 | 7% |
234 Properties |
| 2012 | £144,535 | -4% |
173 Properties |
| 2011 | £150,886 | -6% |
194 Properties |
| 2010 | £160,107 | 5% |
165 Properties |
| 2009 | £151,506 | -13% |
176 Properties |
| 2008 | £170,649 | -2% |
222 Properties |
| 2007 | £173,863 | 7% |
427 Properties |
| 2006 | £161,468 | 8% |
400 Properties |
| 2005 | £148,728 | 4% |
289 Properties |
| 2004 | £143,279 | 10% |
361 Properties |
| 2003 | £129,466 | 19% |
315 Properties |
| 2002 | £105,303 | 16% |
372 Properties |
| 2001 | £88,804 | 15% |
346 Properties |
| 2000 | £75,133 | 1% |
308 Properties |
| 1999 | £74,137 | 15% |
347 Properties |
| 1998 | £63,070 | 1% |
345 Properties |
| 1997 | £62,604 | 7% |
296 Properties |
| 1996 | £57,984 | 7% |
239 Properties |
| 1995 | £53,784 | - |
189 Properties |
Property Price per Property Type in Birmingham
Here you can find historic sold price data in order to help with your property search.
The average Property Paid Price for specific property types in the last three years are:
| Property Type | Average Sold Price | Sold Properties |
|---|---|---|
| Semi Detached House | £244,729.00 | 439 Semi Detached Houses |
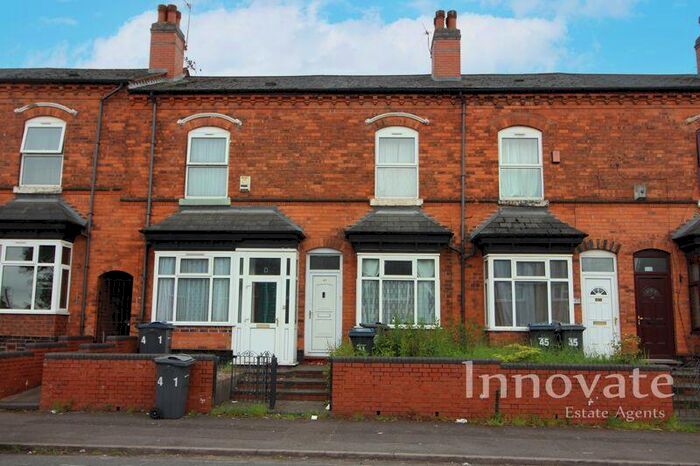
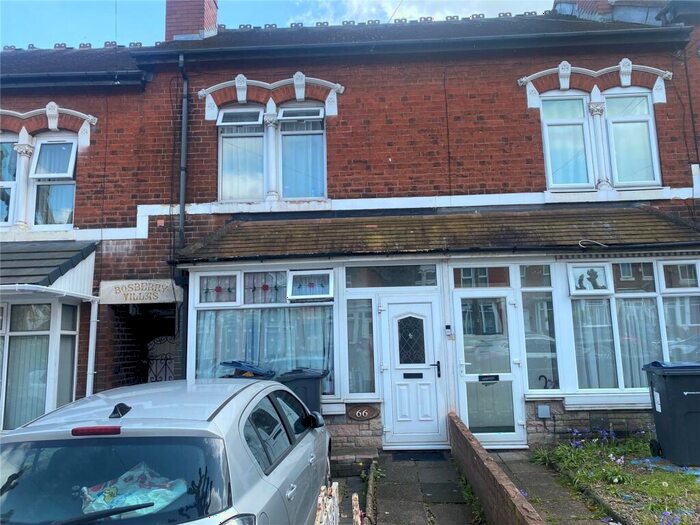
| Terraced House | £210,465.00 | 150 Terraced Houses |
| Detached House | £368,997.00 | 124 Detached Houses |
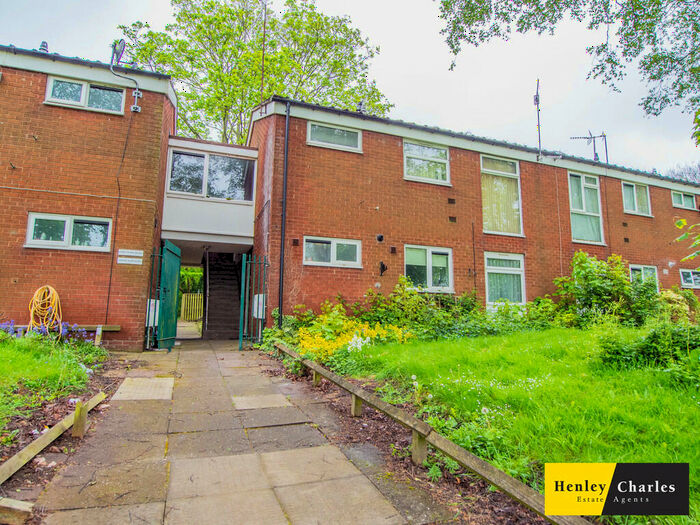
| Flat | £123,600.00 | 109 Flats |