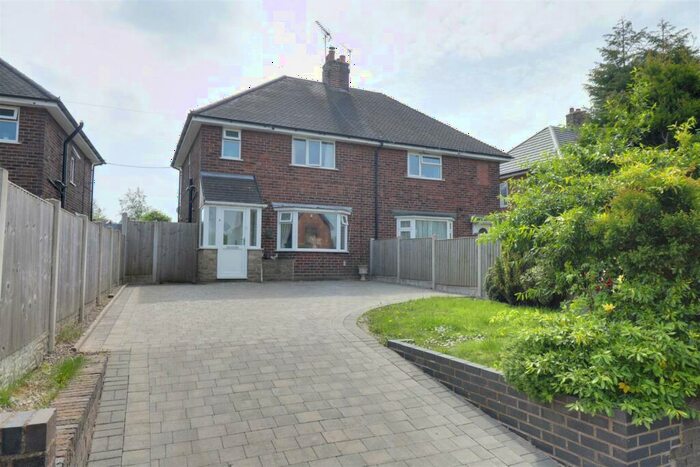
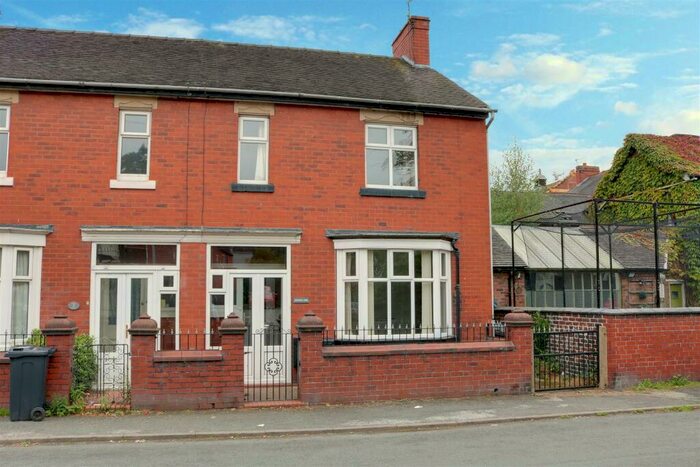
Houses for sale & to rent in Halmerend, Stoke-on-trent
House Prices in Halmerend
Properties in Halmerend have an average house price of £180,877.00 and had 98 Property Transactions within the last 3 years¹.
Halmerend is an area in Stoke-on-trent, Staffordshire with 898 households², where the most expensive property was sold for £520,000.00.
Properties for sale in Halmerend
Roads and Postcodes in Halmerend
Navigate through our locations to find the location of your next house in Halmerend, Stoke-on-trent for sale or to rent.
| Streets | Postcodes |
|---|---|
| Bow Hill Lane | ST7 8DU |
| Cooperative Lane | ST7 8BL |
| Grassy Green Lane | ST7 8JB |
| Harrison Close | ST7 8AE |
| Heathcote Road | ST7 8BH ST7 8LH ST7 8LL ST7 8LN |
| High Lane | ST7 8BS |
| High Street | ST7 8AA ST7 8AD ST7 8AF ST7 8AG ST7 8BA ST7 8BN ST7 8BP ST7 8BQ |
| Hill Crescent | ST7 8BG |
| Holding Crescent | ST7 8AS |
| Hougher Wall Road | ST7 8JA |
| Knowle Bank Road | ST7 8DS |
| Limbrick Road | ST7 8DX |
| Lynsey Close | ST7 8BT |
| Miles Green Road | ST7 8LQ |
| Minnie Close | ST7 8BY |
| Nantwich Road | ST7 8DY |
| Podmore Lane | ST7 8AB |
| Red Hall Lane | ST7 8AX |
| Roberts Close | ST7 8BD |
| Rye Hills | ST7 8LP |
| Scot Hay Road | ST7 8BW |
| Shraley Brook Road | ST7 8AH ST7 8DR |
| Station Road | ST7 8AR ST7 8LJ |
| Station Walks | ST7 8AU |
| The Drive | ST5 6BW ST7 8BB |
| Wesley Place | ST7 8AQ |
| Wynbank Close | ST7 8LR |
Transport near Halmerend
- FAQ
- Price Paid By Year
- Property Type Price
Frequently asked questions about Halmerend
What is the average price for a property for sale in Halmerend?
The average price for a property for sale in Halmerend is £180,877. This amount is 24% lower than the average price in Stoke-on-trent. There are 528 property listings for sale in Halmerend.
What streets have the most expensive properties for sale in Halmerend?
The streets with the most expensive properties for sale in Halmerend are Rye Hills at an average of £338,000, Wynbank Close at an average of £270,500 and The Drive at an average of £269,000.
What streets have the most affordable properties for sale in Halmerend?
The streets with the most affordable properties for sale in Halmerend are Hougher Wall Road at an average of £122,500, Station Road at an average of £152,883 and High Street at an average of £153,609.
Which train stations are available in or near Halmerend?
Some of the train stations available in or near Halmerend are Longport, Alsager and Kidsgrove.
Property Price Paid in Halmerend by Year
The average sold property price by year was:
| Year | Average Sold Price | Price Change |
Sold Properties
|
|---|---|---|---|
| 2024 | £142,666 | -10% |
3 Properties |
| 2023 | £156,842 | -24% |
13 Properties |
| 2022 | £194,216 | 7% |
35 Properties |
| 2021 | £180,031 | 2% |
47 Properties |
| 2020 | £176,562 | 12% |
20 Properties |
| 2019 | £155,913 | 6% |
50 Properties |
| 2018 | £147,074 | 1% |
27 Properties |
| 2017 | £145,033 | -3% |
45 Properties |
| 2016 | £149,345 | -2% |
32 Properties |
| 2015 | £151,755 | 19% |
31 Properties |
| 2014 | £123,019 | 14% |
36 Properties |
| 2013 | £105,635 | -12% |
27 Properties |
| 2012 | £118,412 | -10% |
35 Properties |
| 2011 | £129,995 | 10% |
28 Properties |
| 2010 | £116,810 | -5% |
28 Properties |
| 2009 | £122,369 | -18% |
23 Properties |
| 2008 | £144,402 | 4% |
21 Properties |
| 2007 | £138,996 | 4% |
40 Properties |
| 2006 | £133,490 | 13% |
60 Properties |
| 2005 | £115,945 | 1% |
42 Properties |
| 2004 | £115,335 | 11% |
35 Properties |
| 2003 | £102,953 | 34% |
49 Properties |
| 2002 | £68,005 | 11% |
40 Properties |
| 2001 | £60,426 | 8% |
36 Properties |
| 2000 | £55,594 | -7% |
37 Properties |
| 1999 | £59,327 | 35% |
32 Properties |
| 1998 | £38,648 | -14% |
28 Properties |
| 1997 | £43,881 | -7% |
37 Properties |
| 1996 | £46,890 | 21% |
35 Properties |
| 1995 | £36,887 | - |
20 Properties |
Property Price per Property Type in Halmerend
Here you can find historic sold price data in order to help with your property search.
The average Property Paid Price for specific property types in the last three years are:
| Property Type | Average Sold Price | Sold Properties |
|---|---|---|
| Semi Detached House | £179,122.00 | 20 Semi Detached Houses |
| Terraced House | £140,129.00 | 58 Terraced Houses |
| Flat | £85,000.00 | 2 Flats |
| Detached House | £324,782.00 | 18 Detached Houses |


