
Houses for sale & to rent in Lymm, Warrington
House Prices in Lymm
Properties in Lymm have an average house price of £412,502.00 and had 702 Property Transactions within the last 3 years.¹
Lymm is an area in Warrington with 5,180 households², where the most expensive property was sold for £2,700,000.00.
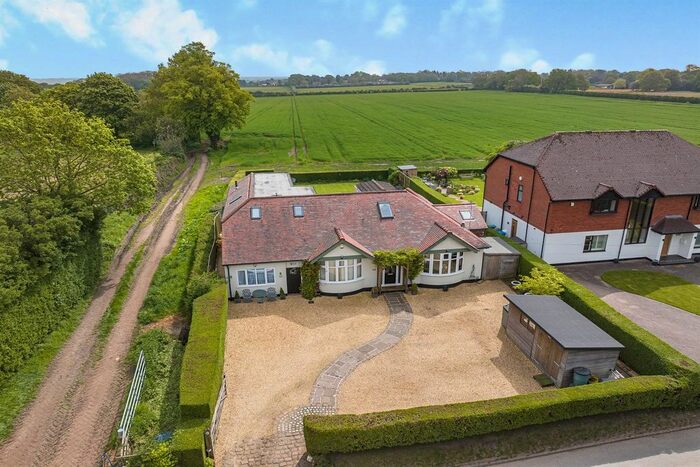
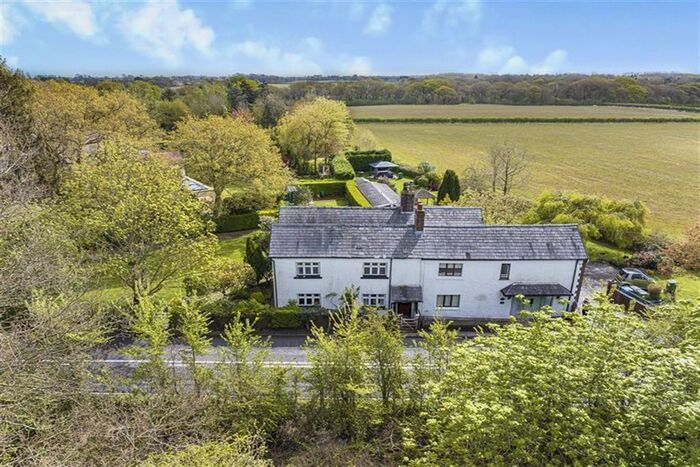
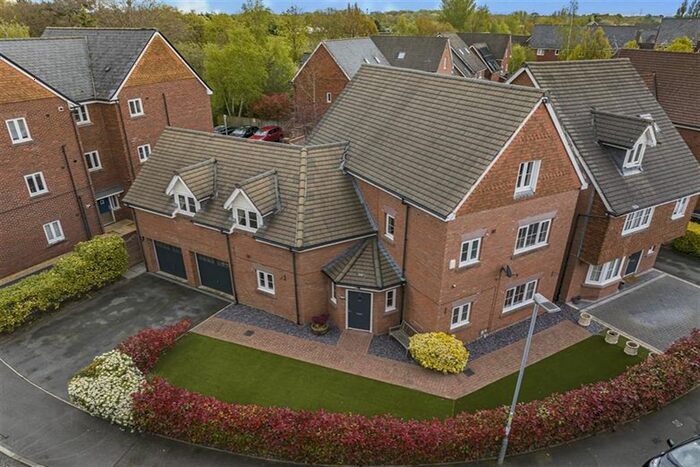
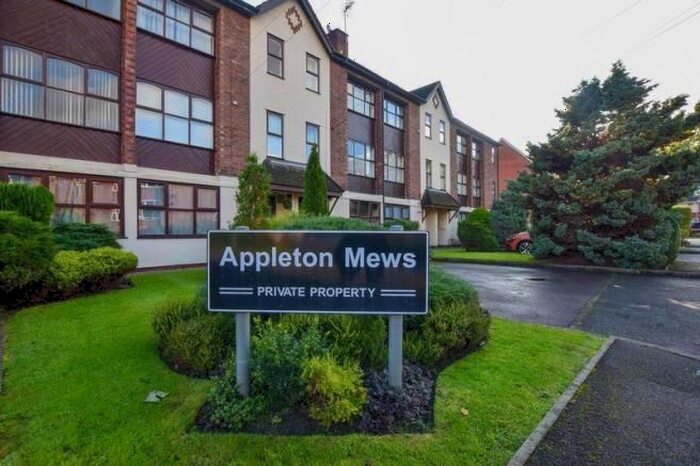
Properties for sale in Lymm


Neighbourhoods in Lymm
Navigate through our locations to find the location of your next house in Lymm, Warrington for sale or to rent.
Transport in Lymm
Please see below transportation links in this area:

- FAQ
- Price Paid By Year
- Property Type Price
Frequently asked questions about Lymm
What is the average price for a property for sale in Lymm?
The average price for a property for sale in Lymm is £412,502. This amount is 43% higher than the average price in Warrington. There are 580 property listings for sale in Lymm.
What locations have the most expensive properties for sale in Lymm?
The locations with the most expensive properties for sale in Lymm are Lymm North and Thelwall at an average of £790,833 and Lymm South at an average of £592,583.
What locations have the most affordable properties for sale in Lymm?
The locations with the most affordable properties for sale in Lymm are Grappenhall And Thelwall at an average of £222,915 and Lymm at an average of £407,158.
Which train stations are available in or near Lymm?
Some of the train stations available in or near Lymm are Birchwood, Glazebrook and Padgate.
Property Price Paid in Lymm by Year
The average sold property price by year was:
| Year | Average Sold Price | Price Change |
Sold Properties
|
|---|---|---|---|
| 2024 | £336,385 | -19% |
14 Properties |
| 2023 | £399,476 | -5% |
170 Properties |
| 2022 | £418,816 | - |
205 Properties |
| 2021 | £418,845 | 8% |
313 Properties |
| 2020 | £384,814 | 3% |
209 Properties |
| 2019 | £375,193 | 6% |
229 Properties |
| 2018 | £353,708 | 6% |
251 Properties |
| 2017 | £333,862 | -5% |
256 Properties |
| 2016 | £350,447 | 7% |
255 Properties |
| 2015 | £327,308 | 14% |
266 Properties |
| 2014 | £280,163 | 0,2% |
283 Properties |
| 2013 | £279,585 | -5% |
206 Properties |
| 2012 | £293,821 | -10% |
194 Properties |
| 2011 | £324,511 | 11% |
174 Properties |
| 2010 | £289,948 | 4% |
177 Properties |
| 2009 | £278,278 | -6% |
145 Properties |
| 2008 | £293,851 | 9% |
184 Properties |
| 2007 | £268,137 | -4% |
405 Properties |
| 2006 | £279,412 | 11% |
339 Properties |
| 2005 | £249,829 | 10% |
258 Properties |
| 2004 | £224,086 | -2% |
295 Properties |
| 2003 | £228,562 | 7% |
378 Properties |
| 2002 | £211,473 | 15% |
406 Properties |
| 2001 | £180,206 | 26% |
274 Properties |
| 2000 | £133,360 | 5% |
251 Properties |
| 1999 | £126,172 | 7% |
290 Properties |
| 1998 | £116,916 | 14% |
271 Properties |
| 1997 | £100,299 | 11% |
238 Properties |
| 1996 | £88,953 | 5% |
245 Properties |
| 1995 | £84,430 | - |
181 Properties |
Property Price per Property Type in Lymm
Here you can find historic sold price data in order to help with your property search.
The average Property Paid Price for specific property types in the last three years are:
| Property Type | Average Sold Price | Sold Properties |
|---|---|---|
| Semi Detached House | £389,529.00 | 250 Semi Detached Houses |
| Terraced House | £329,766.00 | 175 Terraced Houses |
| Detached House | £673,849.00 | 173 Detached Houses |
| Flat | £172,204.00 | 104 Flats |