
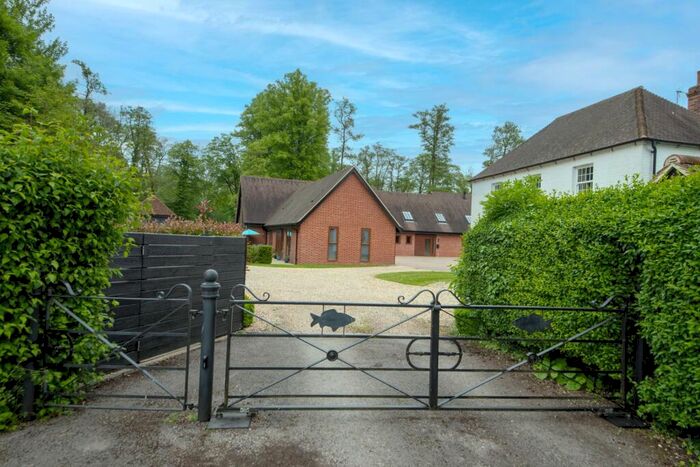
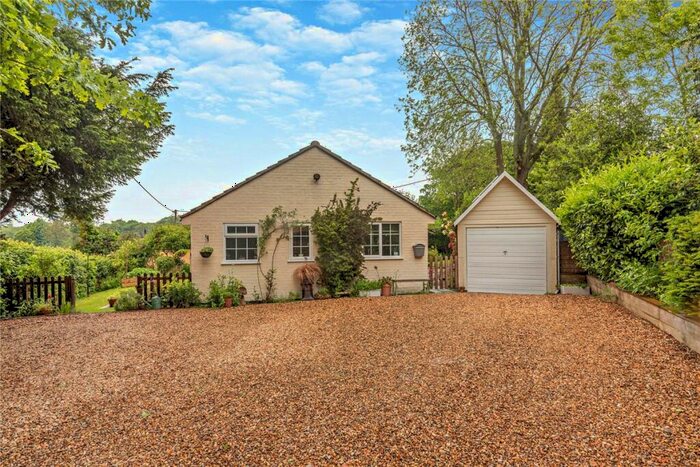
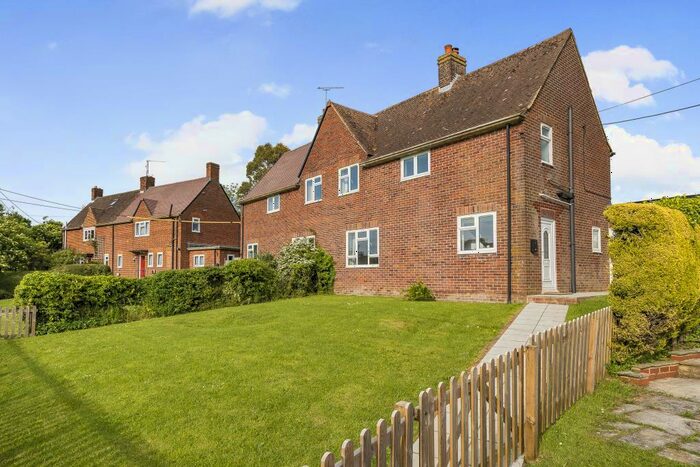
Houses for sale & to rent in Hungerford & Kintbury, Newbury
House Prices in Hungerford & Kintbury
Properties in Hungerford & Kintbury have an average house price of £570,000.00 and had 4 Property Transactions within the last 3 years¹.
Hungerford & Kintbury is an area in Newbury, West Berkshire with 163 households², where the most expensive property was sold for £810,000.00.
Properties for sale in Hungerford & Kintbury


Roads and Postcodes in Hungerford & Kintbury
Navigate through our locations to find the location of your next house in Hungerford & Kintbury, Newbury for sale or to rent.
| Streets | Postcodes |
|---|---|
| Ash Tree Grove | RG20 0HJ |
| Bath Road | RG20 8NR |
| Bell Hill | RG14 6RN |
| Boames Lane | RG20 0JT |
| Burgess Lane | RG20 0HZ |
| Cope Hall Lane | RG14 6EP |
| Enborne Road | RG20 0EY |
| Enborne Row | RG20 0NA |
| Field Court | RG20 0AQ |
| Grayling Lane | RG20 8AZ |
| Holtwood Road | RG20 0HQ |
| Lambourn Road | RG20 8JE |
| Park Lane | RG20 8HP |
| Redhill | RG20 0JN |
| The Green | RG20 0BN |
| The Row | RG20 8HS |
| Wheatlands Lane | RG14 6RF |
| Whitegates | RG20 8HW |
| Wickham Heath | RG20 8PN RG20 8PP |
| Winterbourne Road | RG20 8DS |
| RG20 0BJ RG20 0BL RG20 0BP RG20 0BS RG20 0BT RG20 0BW RG20 0HG RG20 0HS RG20 0HX RG20 0JE RG20 0JJ RG20 0JL RG20 0JU RG20 0LD RG20 8DE RG20 8DL RG20 8DY RG20 8EE RG20 8EX RG20 8HA RG20 8HB RG20 8HR RG20 8HT RG20 8HU RG20 8HX RG20 8HY RG20 8HZ RG20 8NL RG20 8NN RG20 8PD RG20 8PR RG20 8RE RG20 8RG RG20 8RH RG20 0BU |
Transport near Hungerford & Kintbury

- FAQ
- Price Paid By Year
- Property Type Price
Frequently asked questions about Hungerford & Kintbury
What is the average price for a property for sale in Hungerford & Kintbury?
The average price for a property for sale in Hungerford & Kintbury is £570,000. This amount is 35% higher than the average price in Newbury. There are 2,096 property listings for sale in Hungerford & Kintbury.
Which train stations are available in or near Hungerford & Kintbury?
Some of the train stations available in or near Hungerford & Kintbury are Kintbury, Newbury and Newbury Racecourse.
Property Price Paid in Hungerford & Kintbury by Year
The average sold property price by year was:
| Year | Average Sold Price | Price Change |
Sold Properties
|
|---|---|---|---|
| 2023 | £810,000 | 40% |
1 Property |
| 2021 | £490,000 | -33% |
3 Properties |
| 2019 | £650,000 | -698% |
1 Property |
| 2018 | £5,190,000 | 86% |
2 Properties |
| 2016 | £739,500 | 27% |
5 Properties |
| 2015 | £541,000 | - |
4 Properties |
Property Price per Property Type in Hungerford & Kintbury
Here you can find historic sold price data in order to help with your property search.
The average Property Paid Price for specific property types in the last three years are:
| Property Type | Average Sold Price | Sold Properties |
|---|---|---|
| Semi Detached House | £437,500.00 | 2 Semi Detached Houses |
| Detached House | £810,000.00 | 1 Detached House |
| Terraced House | £595,000.00 | 1 Terraced House |