
Houses for sale & to rent in Inkberrow, Evesham
House Prices in Inkberrow
Properties in Inkberrow have an average house price of £578,046.00 and had 57 Property Transactions within the last 3 years¹.
Inkberrow is an area in Evesham, Worcestershire with 358 households², where the most expensive property was sold for £1,500,000.00.
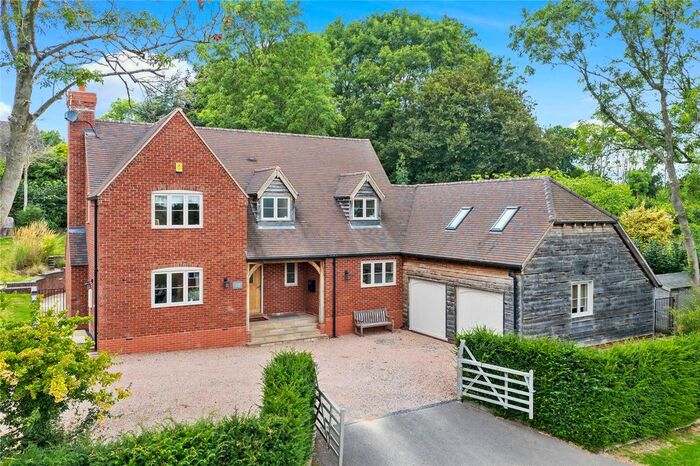
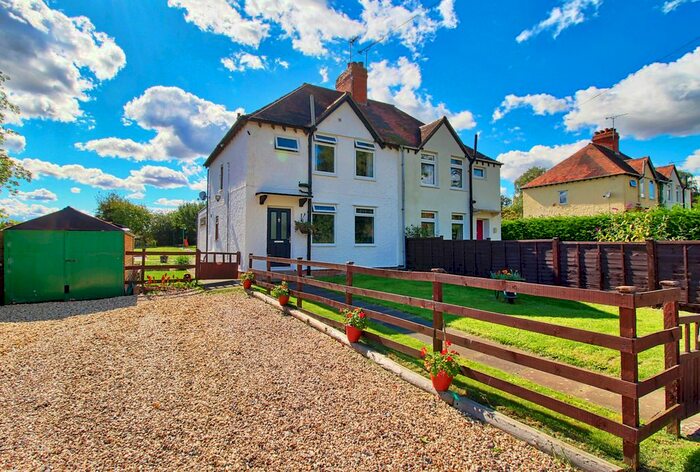
Properties for sale in Inkberrow


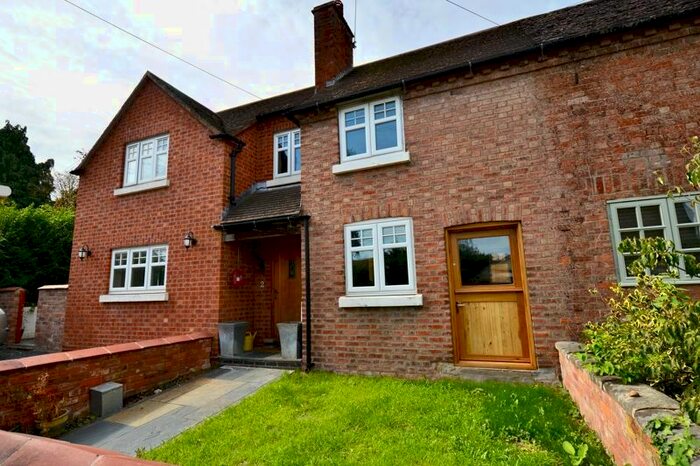
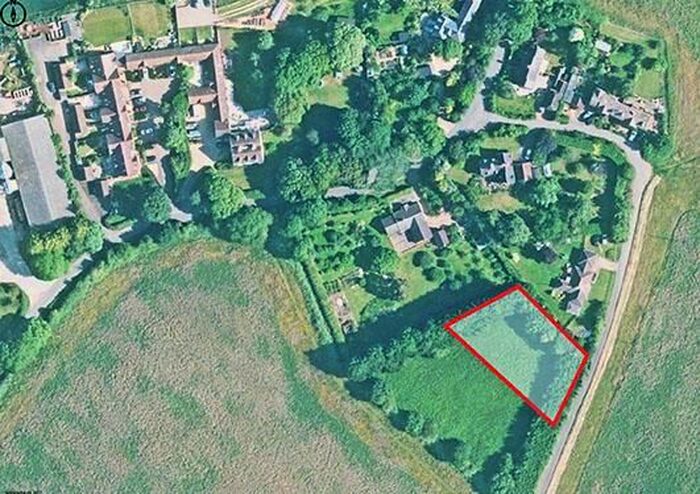
Previously listed properties in Inkberrow


Roads and Postcodes in Inkberrow
Navigate through our locations to find the location of your next house in Inkberrow, Evesham for sale or to rent.
| Streets | Postcodes |
|---|---|
| Ab Lench Road | WR11 4UQ |
| Atch Lench Road | WR11 4UG |
| Badgers Hill | WR11 4SD |
| Evesham Road | WR11 4UB |
| Farm Lane | WR11 4SZ |
| Handgate Lane | WR11 4LY |
| Low Road | WR11 4UH |
| Main Street | WR11 4UE |
| Malthouse Lane | WR11 4UF |
| Orchard Close | WR11 4DG |
| Radford Road | WR11 4UL |
| The Croft | WR11 4UD |
| The Green | WR11 4UN |
| WR11 4SN WR11 4SW WR11 4UJ WR11 4UP WR11 4UW |
Transport near Inkberrow

- FAQ
- Price Paid By Year
- Property Type Price
Frequently asked questions about Inkberrow
What is the average price for a property for sale in Inkberrow?
The average price for a property for sale in Inkberrow is £578,046. This amount is 61% higher than the average price in Evesham. There are 42 property listings for sale in Inkberrow.
What streets have the most expensive properties for sale in Inkberrow?
The streets with the most expensive properties for sale in Inkberrow are Low Road at an average of £700,909, Evesham Road at an average of £676,500 and Malthouse Lane at an average of £650,000.
What streets have the most affordable properties for sale in Inkberrow?
The streets with the most affordable properties for sale in Inkberrow are The Croft at an average of £268,333, Radford Road at an average of £409,250 and Main Street at an average of £486,125.
Which train stations are available in or near Inkberrow?
Some of the train stations available in or near Inkberrow are Evesham, Pershore and Honeybourne.
Property Price Paid in Inkberrow by Year
The average sold property price by year was:
| Year | Average Sold Price | Price Change |
Sold Properties
|
|---|---|---|---|
| 2023 | £703,958 | 22% |
12 Properties |
| 2022 | £550,389 | 2% |
17 Properties |
| 2021 | £540,875 | -44% |
28 Properties |
| 2020 | £776,444 | 40% |
9 Properties |
| 2019 | £469,428 | 22% |
7 Properties |
| 2018 | £365,810 | -12% |
25 Properties |
| 2017 | £411,100 | -35% |
20 Properties |
| 2016 | £553,461 | 8% |
13 Properties |
| 2015 | £510,214 | 26% |
7 Properties |
| 2014 | £376,550 | -30% |
9 Properties |
| 2013 | £489,675 | -23% |
14 Properties |
| 2012 | £600,428 | 33% |
7 Properties |
| 2011 | £399,923 | 1% |
13 Properties |
| 2010 | £396,859 | 2% |
11 Properties |
| 2009 | £389,375 | -56% |
8 Properties |
| 2008 | £606,141 | 17% |
6 Properties |
| 2007 | £505,715 | 7% |
16 Properties |
| 2006 | £472,142 | 21% |
7 Properties |
| 2005 | £375,249 | -34% |
21 Properties |
| 2004 | £502,333 | 41% |
15 Properties |
| 2003 | £297,210 | 15% |
10 Properties |
| 2002 | £253,228 | 9% |
16 Properties |
| 2001 | £230,670 | 14% |
13 Properties |
| 2000 | £199,166 | 19% |
9 Properties |
| 1999 | £162,246 | -14% |
17 Properties |
| 1998 | £184,653 | 28% |
13 Properties |
| 1997 | £133,522 | 4% |
18 Properties |
| 1996 | £128,142 | 10% |
14 Properties |
| 1995 | £114,729 | - |
12 Properties |
Property Price per Property Type in Inkberrow
Here you can find historic sold price data in order to help with your property search.
The average Property Paid Price for specific property types in the last three years are:
| Property Type | Average Sold Price | Sold Properties |
|---|---|---|
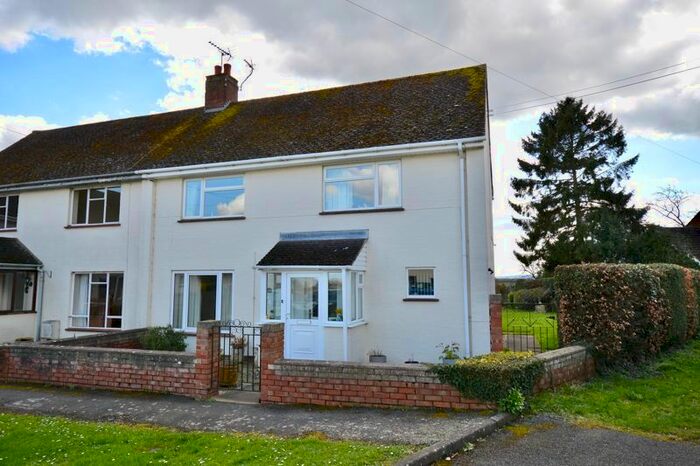
| Semi Detached House | £410,392.00 | 14 Semi Detached Houses |
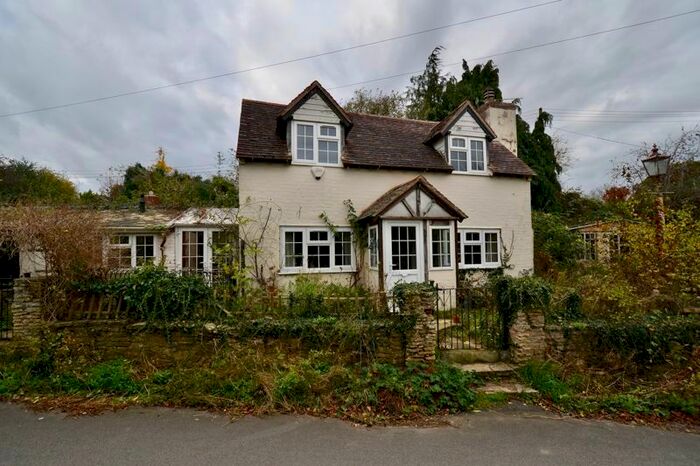
| Terraced House | £449,500.00 | 9 Terraced Houses |
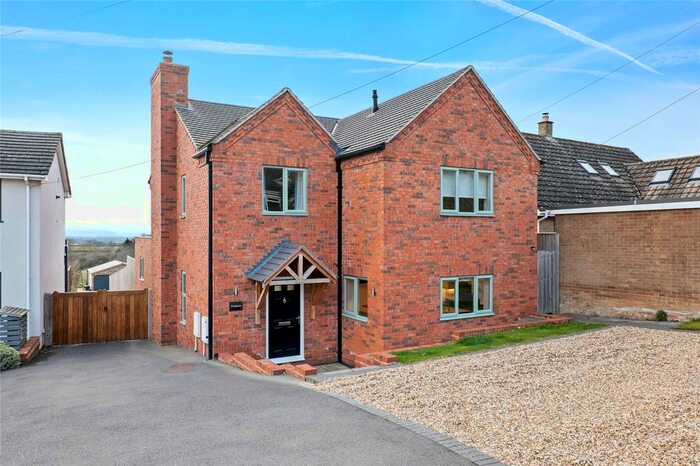
| Detached House | £681,106.00 | 34 Detached Houses |