
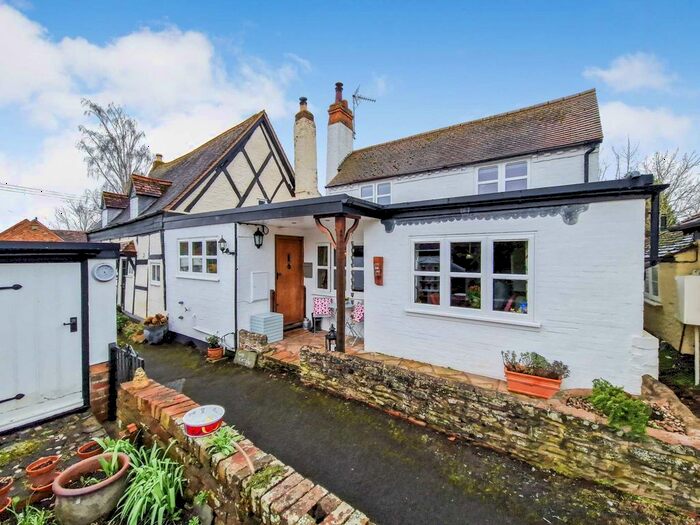
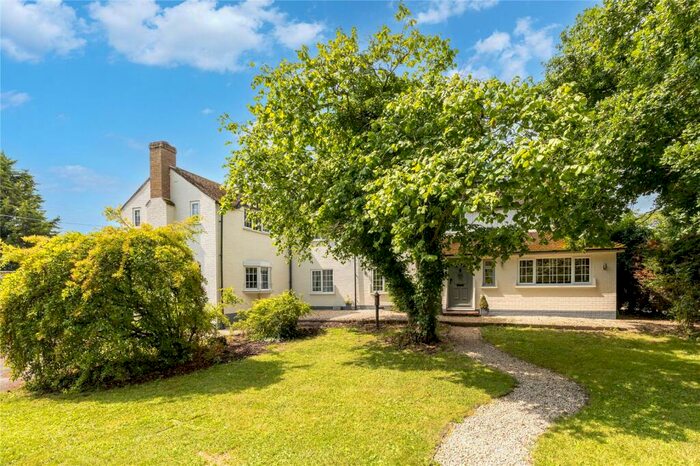
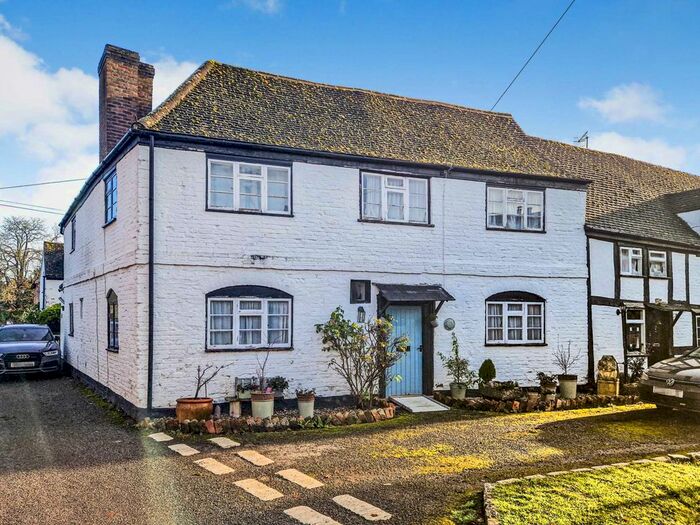
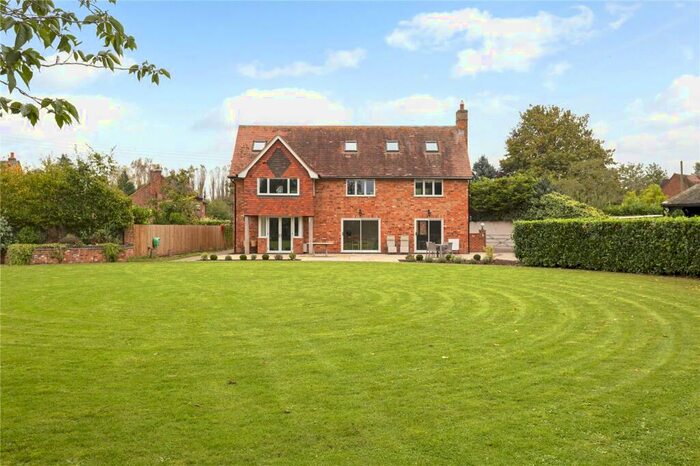
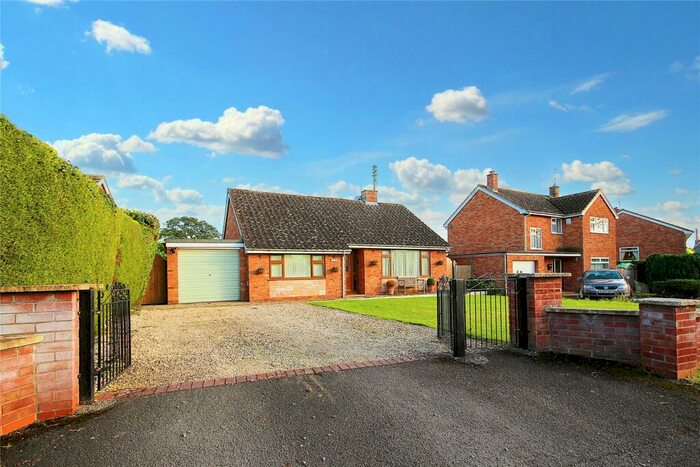
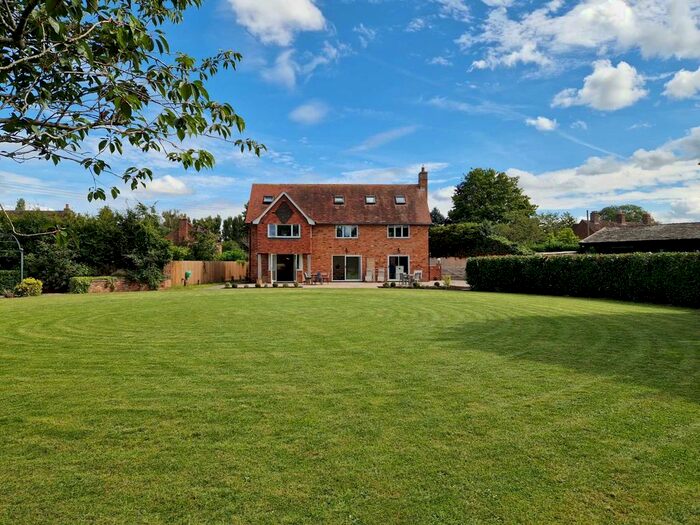
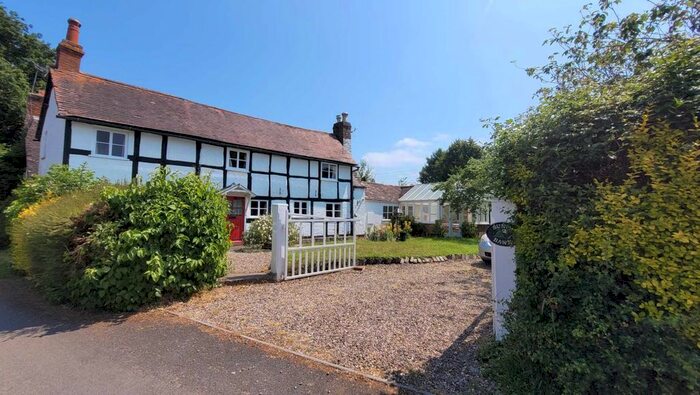
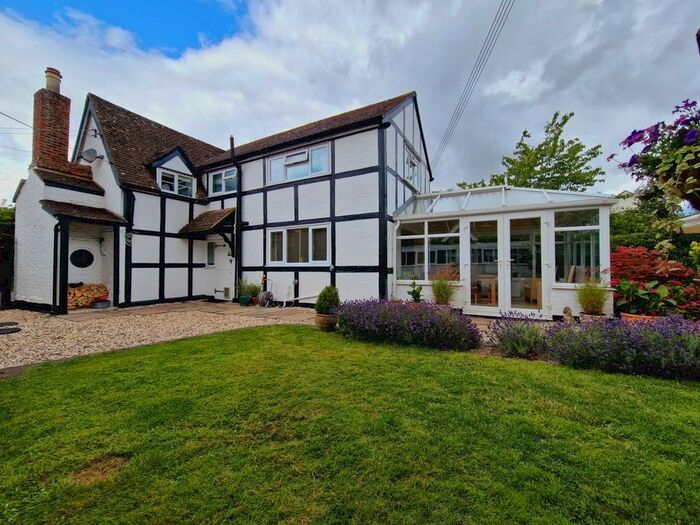
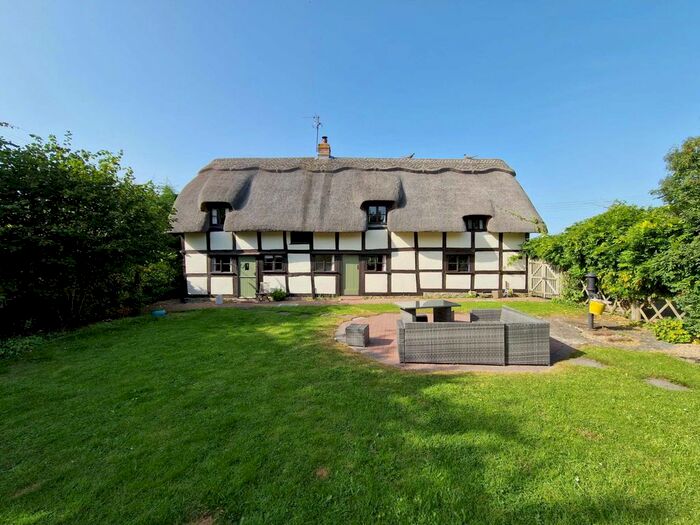
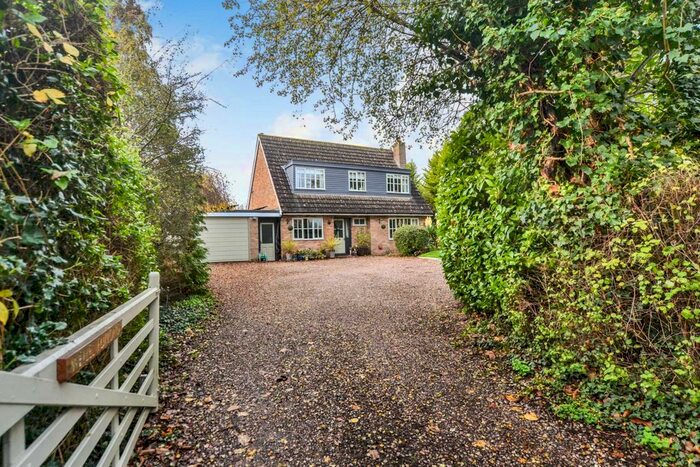
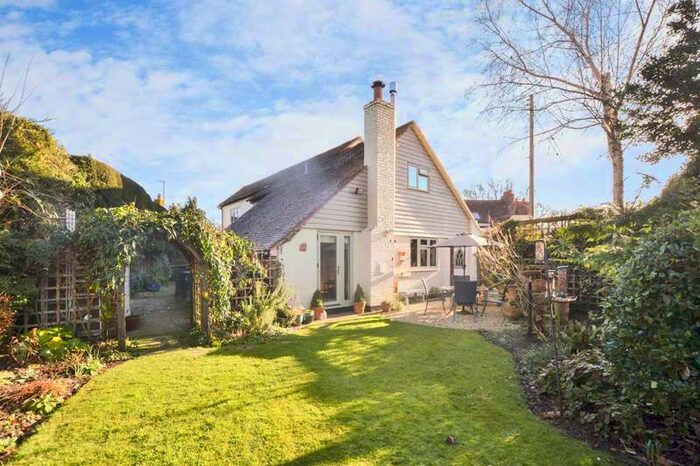
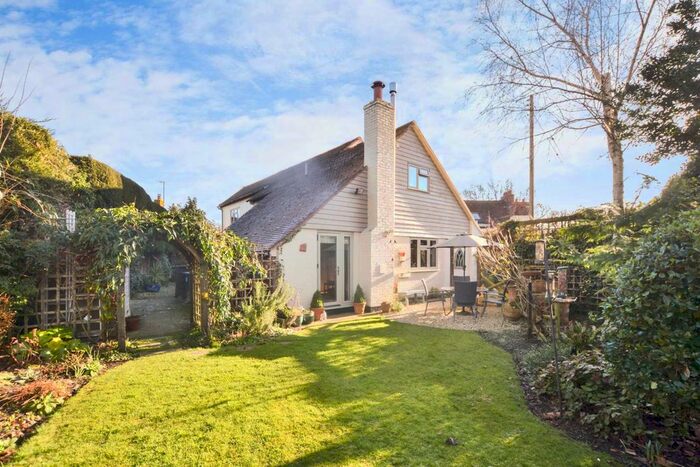
Houses for sale & to rent in Ripple, Tewkesbury
House Prices in Ripple
Properties in Ripple have an average house price of £589,923.00 and had 13 Property Transactions within the last 3 years¹.
Ripple is an area in Tewkesbury, Worcestershire with 158 households², where the most expensive property was sold for £1,130,000.00.
Properties for sale in Ripple


Previously listed properties in Ripple


Roads and Postcodes in Ripple
Navigate through our locations to find the location of your next house in Ripple, Tewkesbury for sale or to rent.
| Streets | Postcodes |
|---|---|
| Bow Lane | GL20 6EW |
| Ferry Lane | GL20 6ER |
| Rectory Lane | GL20 6HQ |
| Saxons Lode | GL20 6ET |
| School Lane | GL20 6EU |
| Station Road | GL20 6EY |
| Stratford Bridge | GL20 6HE |
| The Cross | GL20 6EZ GL20 6HA |
| GL20 6EP GL20 6ES GL20 6EX |
Transport near Ripple

- FAQ
- Price Paid By Year
- Property Type Price
Frequently asked questions about Ripple
What is the average price for a property for sale in Ripple?
The average price for a property for sale in Ripple is £589,923. This amount is 16% higher than the average price in Tewkesbury. There are 32 property listings for sale in Ripple.
What streets have the most expensive properties for sale in Ripple?
The streets with the most expensive properties for sale in Ripple are Ferry Lane at an average of £500,000 and Stratford Bridge at an average of £500,000.
What streets have the most affordable properties for sale in Ripple?
The streets with the most affordable properties for sale in Ripple are Saxons Lode at an average of £437,000 and School Lane at an average of £474,750.
Which train stations are available in or near Ripple?
Some of the train stations available in or near Ripple are Ashchurch, Great Malvern and Colwall.
Property Price Paid in Ripple by Year
The average sold property price by year was:
| Year | Average Sold Price | Price Change |
Sold Properties
|
|---|---|---|---|
| 2024 | £1,130,000 | 41% |
1 Property |
| 2023 | £667,500 | 16% |
1 Property |
| 2022 | £558,687 | 16% |
8 Properties |
| 2021 | £467,333 | -50% |
3 Properties |
| 2020 | £703,333 | 36% |
3 Properties |
| 2019 | £448,170 | -30% |
6 Properties |
| 2018 | £582,000 | 36% |
5 Properties |
| 2017 | £373,978 | -14% |
9 Properties |
| 2016 | £425,166 | -0,1% |
6 Properties |
| 2015 | £425,714 | 32% |
7 Properties |
| 2014 | £289,990 | 16% |
5 Properties |
| 2013 | £245,000 | -36% |
1 Property |
| 2012 | £332,958 | -26% |
6 Properties |
| 2011 | £418,000 | 2% |
1 Property |
| 2010 | £409,166 | -67% |
3 Properties |
| 2009 | £681,825 | 48% |
4 Properties |
| 2007 | £353,990 | -28% |
5 Properties |
| 2006 | £451,428 | 24% |
7 Properties |
| 2005 | £344,700 | -8% |
5 Properties |
| 2004 | £372,318 | 43% |
11 Properties |
| 2003 | £213,906 | -29% |
8 Properties |
| 2002 | £275,041 | 18% |
12 Properties |
| 2001 | £225,062 | 2% |
8 Properties |
| 2000 | £220,166 | 47% |
9 Properties |
| 1999 | £117,625 | -94% |
4 Properties |
| 1998 | £228,285 | 33% |
7 Properties |
| 1997 | £153,750 | 22% |
4 Properties |
| 1996 | £120,550 | 27% |
10 Properties |
| 1995 | £88,375 | - |
4 Properties |
Property Price per Property Type in Ripple
Here you can find historic sold price data in order to help with your property search.
The average Property Paid Price for specific property types in the last three years are:
| Property Type | Average Sold Price | Sold Properties |
|---|---|---|
| Detached House | £589,923.00 | 13 Detached Houses |