
Houses for sale & to rent in Huntly, Strathbogie and Howe of Alford, Inverurie
House Prices in Huntly, Strathbogie and Howe of Alford
Properties in Huntly, Strathbogie and Howe of Alford have an average house price of £285,715.00 and had 56 Property Transactions within the last 3 years¹.
Huntly, Strathbogie and Howe of Alford is an area in Inverurie, Aberdeenshire with 338 households², where the most expensive property was sold for £665,000.00.
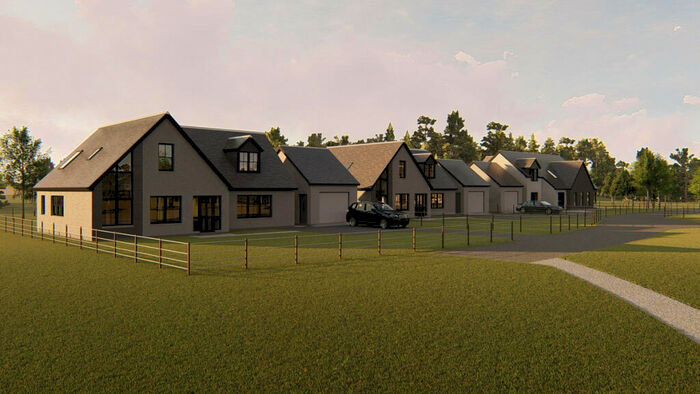
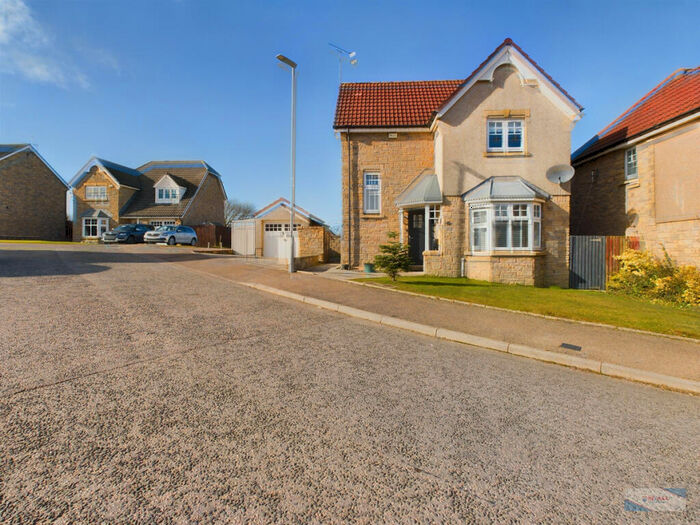
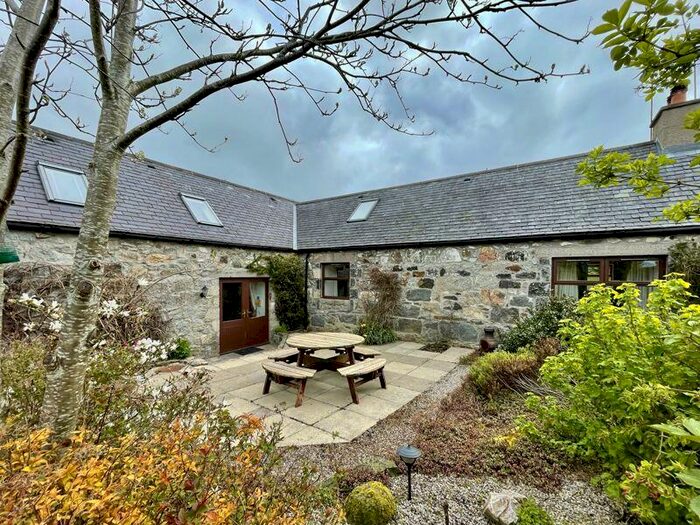
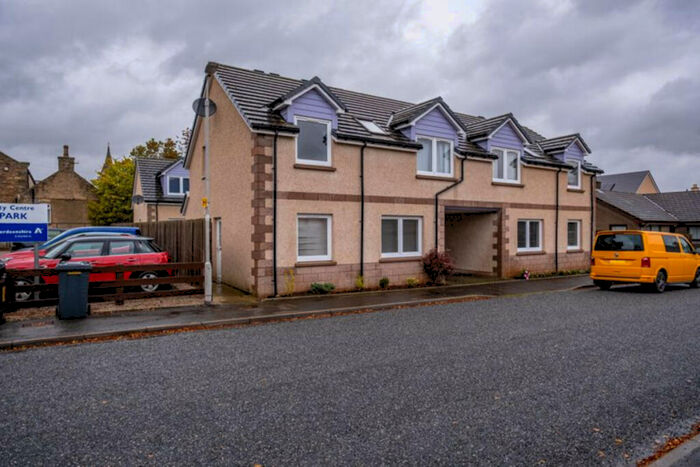
Properties for sale in Huntly, Strathbogie and Howe of Alford


Roads and Postcodes in Huntly, Strathbogie and Howe of Alford
Navigate through our locations to find the location of your next house in Huntly, Strathbogie and Howe of Alford, Inverurie for sale or to rent.
| Streets | Postcodes |
|---|---|
| Don View | AB51 7JE |
| St Andrews | AB51 7HE AB51 7HU |
| St Andrews Terrace | AB51 7HG |
| St Marys | AB51 7HH |
| St Ninians | AB51 7HF |
| St Thomas | AB51 7HQ |
| AB51 5LP AB51 5LQ AB51 5LR AB51 5LS AB51 7HA AB51 7HB AB51 7HD AB51 7HJ AB51 7HL AB51 7HN AB51 7HP AB51 7HR AB51 7HS AB51 7HT AB51 7HW AB51 7HX AB51 7JA AB51 7JB AB51 7JD AB51 7JJ AB51 7JL AB51 7JN AB51 7SD AB51 7SJ AB51 7SN AB51 7SP AB51 7SQ AB51 7SR AB51 7SS AB51 8XU AB51 8XX |
Transport near Huntly, Strathbogie and Howe of Alford

- FAQ
- Price Paid By Year
Frequently asked questions about Huntly, Strathbogie and Howe of Alford
What is the average price for a property for sale in Huntly, Strathbogie and Howe of Alford?
The average price for a property for sale in Huntly, Strathbogie and Howe of Alford is £285,715. This amount is 15% higher than the average price in Inverurie. There are 433 property listings for sale in Huntly, Strathbogie and Howe of Alford.
What streets have the most expensive properties for sale in Huntly, Strathbogie and Howe of Alford?
The streets with the most expensive properties for sale in Huntly, Strathbogie and Howe of Alford are St Andrews at an average of £329,187 and St Thomas at an average of £313,500.
What streets have the most affordable properties for sale in Huntly, Strathbogie and Howe of Alford?
The streets with the most affordable properties for sale in Huntly, Strathbogie and Howe of Alford are St Marys at an average of £159,300 and St Ninians at an average of £250,000.
Which train stations are available in or near Huntly, Strathbogie and Howe of Alford?
Some of the train stations available in or near Huntly, Strathbogie and Howe of Alford are Inverurie, Insch and Dyce.
Property Price Paid in Huntly, Strathbogie and Howe of Alford by Year
The average sold property price by year was:
| Year | Average Sold Price | Price Change |
Sold Properties
|
|---|---|---|---|
| 2023 | £177,333 | -87% |
3 Properties |
| 2022 | £331,078 | 20% |
22 Properties |
| 2021 | £264,011 | -11% |
31 Properties |
| 2020 | £293,635 | 0,2% |
12 Properties |
| 2019 | £292,963 | 7% |
15 Properties |
| 2018 | £271,506 | 8% |
11 Properties |
| 2017 | £250,599 | -18% |
10 Properties |
| 2016 | £295,870 | -15% |
29 Properties |
| 2015 | £341,179 | 23% |
25 Properties |
| 2014 | £263,216 | -1% |
29 Properties |
| 2013 | £266,040 | -11% |
30 Properties |
| 2012 | £296,216 | -3% |
17 Properties |
| 2011 | £305,892 | 4% |
14 Properties |
| 2010 | £294,391 | 11% |
7 Properties |
| 2009 | £262,100 | 28% |
5 Properties |
| 2008 | £189,950 | -27% |
8 Properties |
| 2007 | £241,269 | 40% |
13 Properties |
| 2006 | £144,785 | -18% |
7 Properties |
| 2005 | £170,447 | -9% |
12 Properties |
| 2004 | £186,234 | 34% |
16 Properties |
| 2003 | £122,722 | 0,4% |
13 Properties |
| 2002 | £122,197 | - |
16 Properties |