
Houses for sale & to rent in Turriff and District, Inverurie
House Prices in Turriff and District
Properties in Turriff and District have an average house price of £218,216.00 and had 70 Property Transactions within the last 3 years¹.
Turriff and District is an area in Inverurie, Aberdeenshire with 741 households², where the most expensive property was sold for £610,000.00.
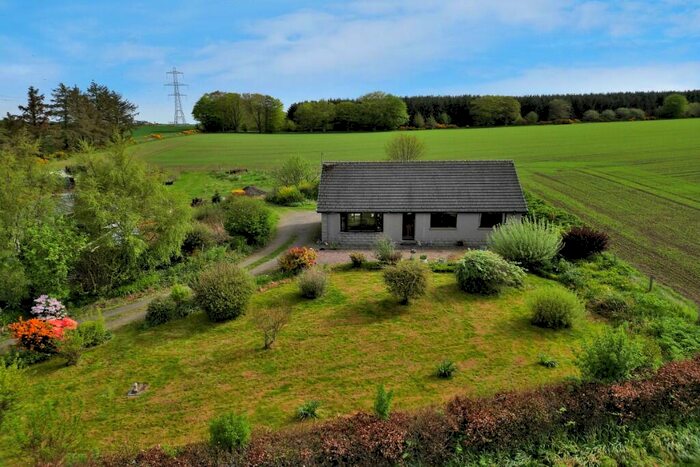
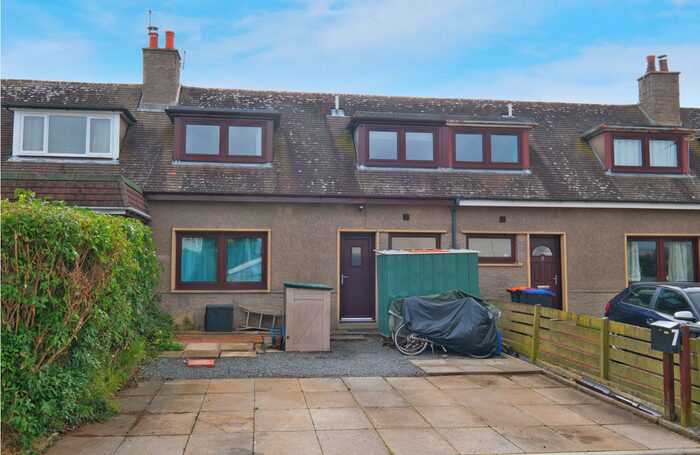
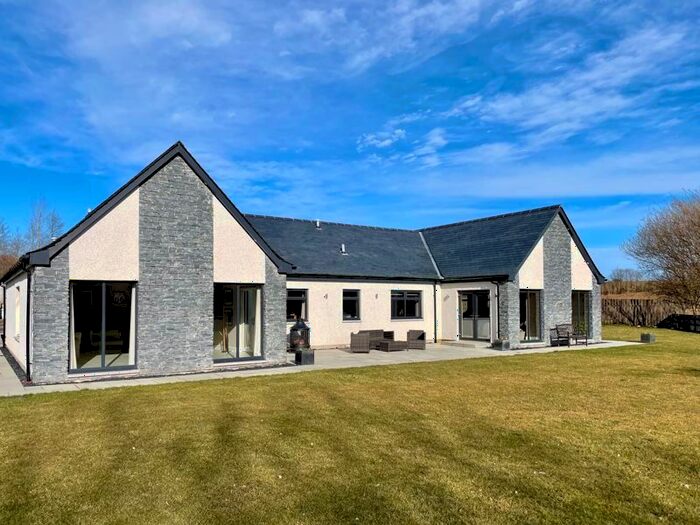
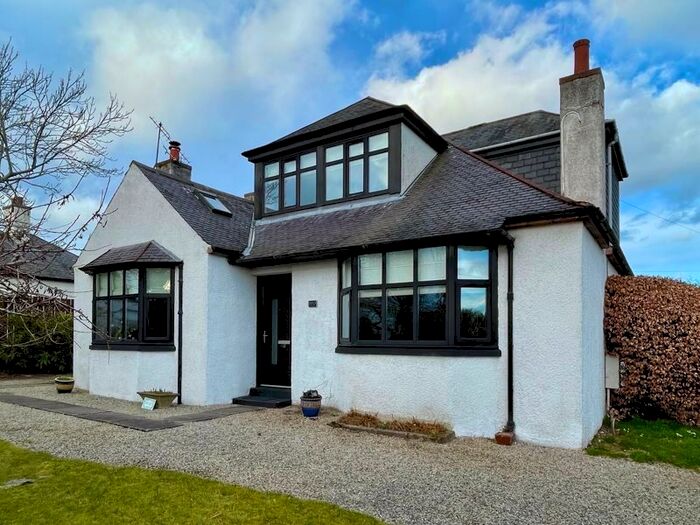
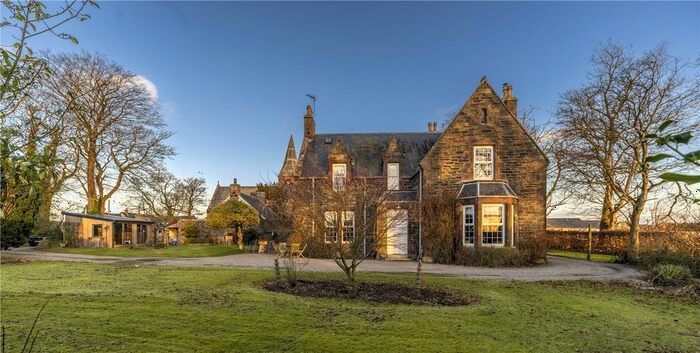
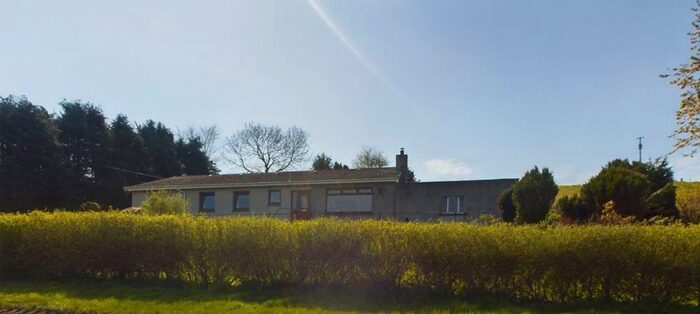
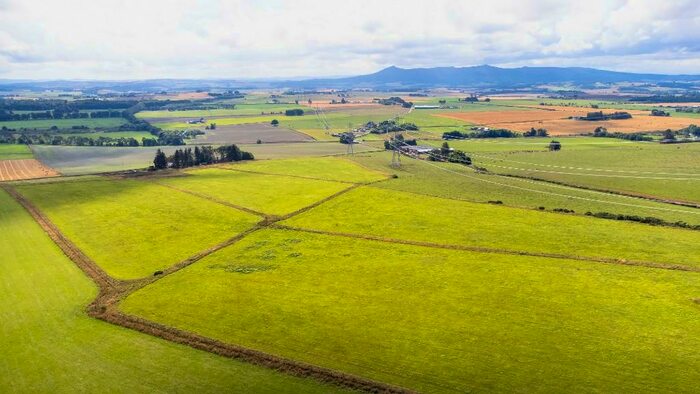
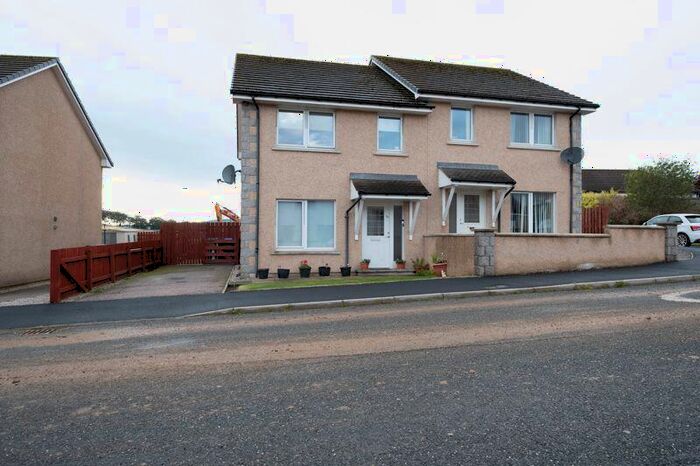
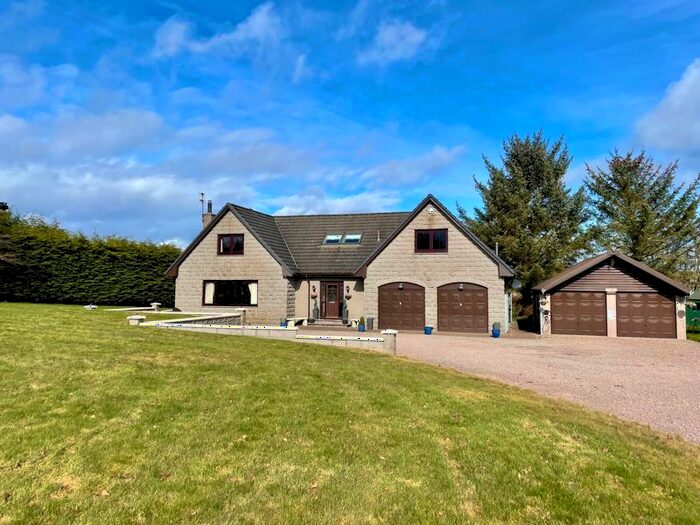
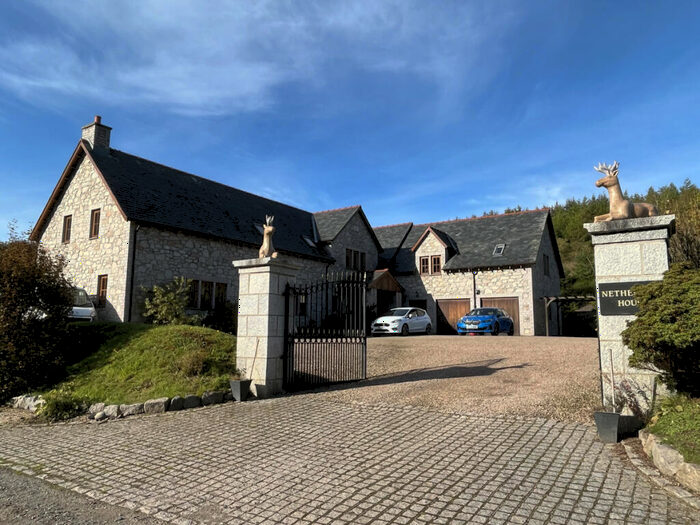
Properties for sale in Turriff and District


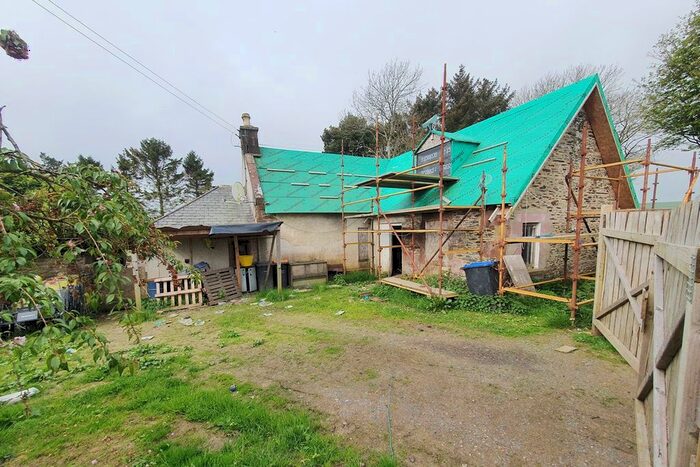
Previously listed properties in Turriff and District


Roads and Postcodes in Turriff and District
Navigate through our locations to find the location of your next house in Turriff and District, Inverurie for sale or to rent.
Transport near Turriff and District

- FAQ
- Price Paid By Year
Frequently asked questions about Turriff and District
What is the average price for a property for sale in Turriff and District?
The average price for a property for sale in Turriff and District is £218,216. This amount is 12% lower than the average price in Inverurie. There are 126 property listings for sale in Turriff and District.
What streets have the most expensive properties for sale in Turriff and District?
The streets with the most expensive properties for sale in Turriff and District are Gordon Place at an average of £293,333, Homefarm Place at an average of £264,833 and Drumsinnie Drive at an average of £252,500.
What streets have the most affordable properties for sale in Turriff and District?
The streets with the most affordable properties for sale in Turriff and District are Smithy Road at an average of £138,250, Fraser Court at an average of £152,962 and Fraser Way at an average of £155,000.
Which train stations are available in or near Turriff and District?
Some of the train stations available in or near Turriff and District are Insch, Inverurie and Huntly.
Property Price Paid in Turriff and District by Year
The average sold property price by year was:
| Year | Average Sold Price | Price Change |
Sold Properties
|
|---|---|---|---|
| 2023 | £167,000 | -29% |
4 Properties |
| 2022 | £214,650 | -5% |
26 Properties |
| 2021 | £225,655 | 2% |
40 Properties |
| 2020 | £221,022 | 8% |
22 Properties |
| 2019 | £203,978 | -0,1% |
32 Properties |
| 2018 | £204,164 | 2% |
31 Properties |
| 2017 | £200,500 | 13% |
25 Properties |
| 2016 | £175,016 | -26% |
30 Properties |
| 2015 | £219,846 | -16% |
51 Properties |
| 2014 | £255,788 | 22% |
46 Properties |
| 2013 | £198,500 | -12% |
33 Properties |
| 2012 | £223,162 | 5% |
39 Properties |
| 2011 | £211,328 | -0,3% |
54 Properties |
| 2010 | £212,025 | 15% |
44 Properties |
| 2009 | £179,444 | -3% |
48 Properties |
| 2008 | £183,934 | -35% |
22 Properties |
| 2007 | £247,683 | 29% |
25 Properties |
| 2006 | £176,857 | 27% |
23 Properties |
| 2005 | £129,026 | 9% |
31 Properties |
| 2004 | £117,395 | 11% |
32 Properties |
| 2003 | £103,921 | 33% |
37 Properties |
| 2002 | £69,254 | -21% |
33 Properties |
| 2001 | £83,500 | - |
1 Property |