
Houses for sale & to rent in Campbeltown, Argyll and Bute
House Prices in Campbeltown
Properties in Campbeltown have an average house price of £125,326.00 and had 352 Property Transactions within the last 3 years.¹
Campbeltown is an area in Argyll and Bute with 3,539 households², where the most expensive property was sold for £885,000.00.
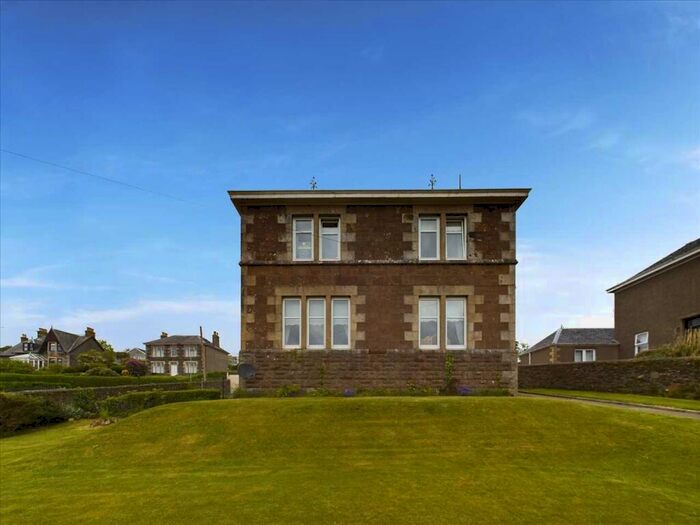
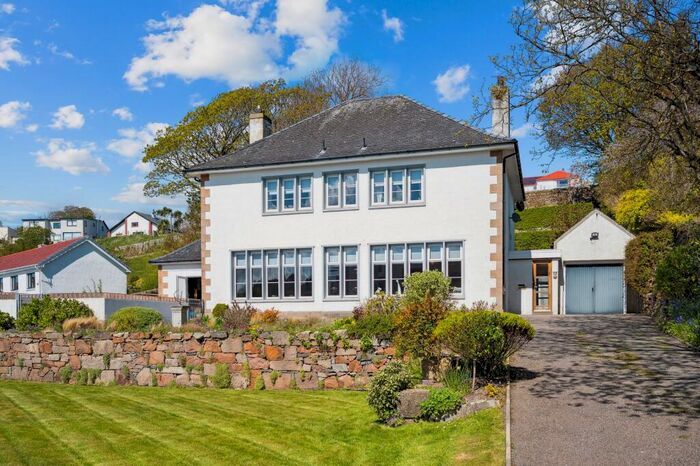
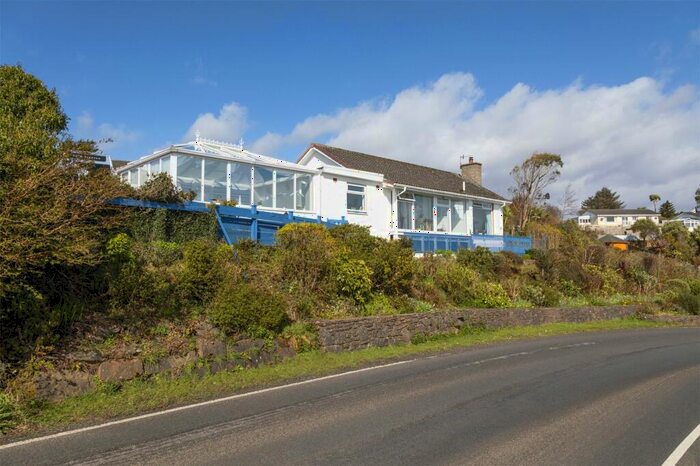
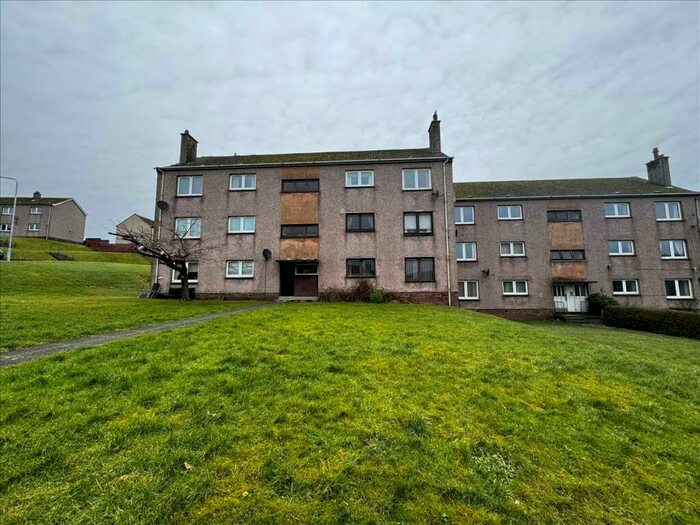
Properties for sale in Campbeltown


Neighbourhoods in Campbeltown
Navigate through our locations to find the location of your next house in Campbeltown, Argyll and Bute for sale or to rent.
Transport in Campbeltown
Please see below transportation links in this area:
-
 Girvan Station
 -
Ardrossan Harbour Station
-
Ardrossan Town Station
-
West Kilbride Station
-
Ardrossan South Beach Station
-
Saltcoats Station
-
Stevenston Station
-
Fairlie Station
-
Maybole Station
-
Largs Station
- FAQ
- Price Paid By Year
Frequently asked questions about Campbeltown
What is the average price for a property for sale in Campbeltown?
The average price for a property for sale in Campbeltown is £125,326. This amount is 47% lower than the average price in Argyll and Bute. There are 289 property listings for sale in Campbeltown.
What locations have the most expensive properties for sale in Campbeltown?
The location with the most expensive properties for sale in Campbeltown is Kintyre and the Islands at an average of £181,815.
What locations have the most affordable properties for sale in Campbeltown?
The location with the most affordable properties for sale in Campbeltown is South Kintyre at an average of £121,377.
Which train stations are available in or near Campbeltown?
Some of the train stations available in or near Campbeltown are Girvan, Ardrossan Harbour and Ardrossan Town.
Property Price Paid in Campbeltown by Year
The average sold property price by year was:
| Year | Average Sold Price | Price Change |
Sold Properties
|
|---|---|---|---|
| 2023 | £150,353 | 8% |
28 Properties |
| 2022 | £138,463 | 21% |
152 Properties |
| 2021 | £109,643 | -5% |
172 Properties |
| 2020 | £114,620 | 15% |
115 Properties |
| 2019 | £97,296 | -11% |
107 Properties |
| 2018 | £107,763 | -4% |
115 Properties |
| 2017 | £111,560 | 18% |
131 Properties |
| 2016 | £92,005 | -20% |
117 Properties |
| 2015 | £109,961 | 24% |
119 Properties |
| 2014 | £83,210 | -21% |
109 Properties |
| 2013 | £100,885 | -2% |
89 Properties |
| 2012 | £103,240 | -3% |
87 Properties |
| 2011 | £106,064 | 7% |
95 Properties |
| 2010 | £98,676 | 2% |
85 Properties |
| 2009 | £96,478 | 5% |
113 Properties |
| 2008 | £91,210 | -4% |
137 Properties |
| 2007 | £95,027 | 14% |
174 Properties |
| 2006 | £81,974 | 11% |
177 Properties |
| 2005 | £73,024 | 24% |
184 Properties |
| 2004 | £55,418 | 18% |
205 Properties |
| 2003 | £45,416 | -3% |
213 Properties |
| 2002 | £46,560 | 2% |
184 Properties |
| 2001 | £45,696 | - |
14 Properties |