
Houses for sale & to rent in Lerwick South, Shetland
House Prices in Lerwick South
Properties in Lerwick South have an average house price of £223,740.00 and had 123 Property Transactions within the last 3 years¹.
Lerwick South is an area in Shetland, Shetland Islands with 1,995 households², where the most expensive property was sold for £550,000.00.
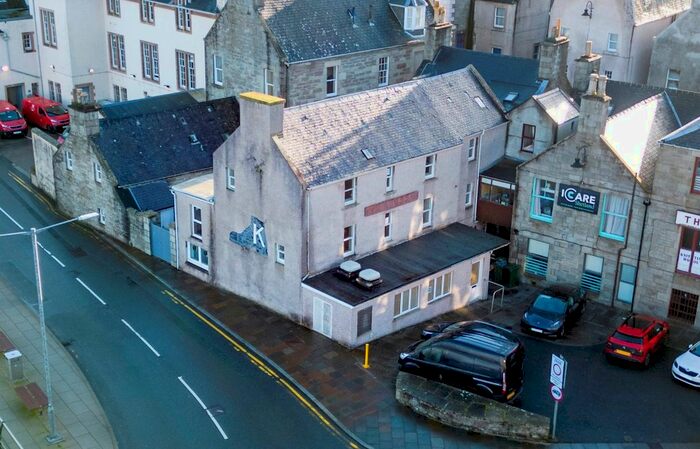
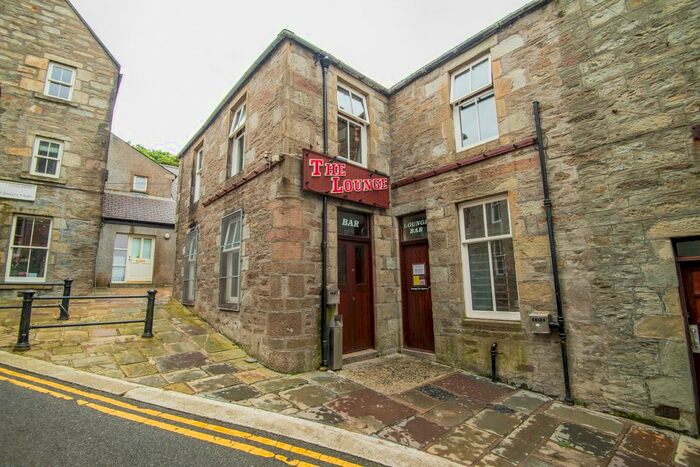
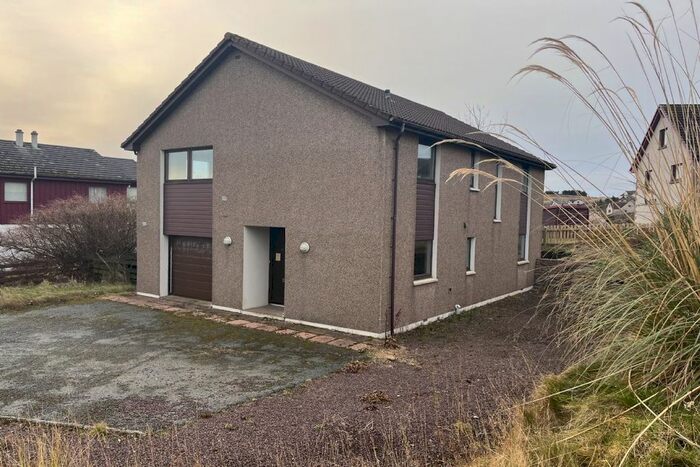
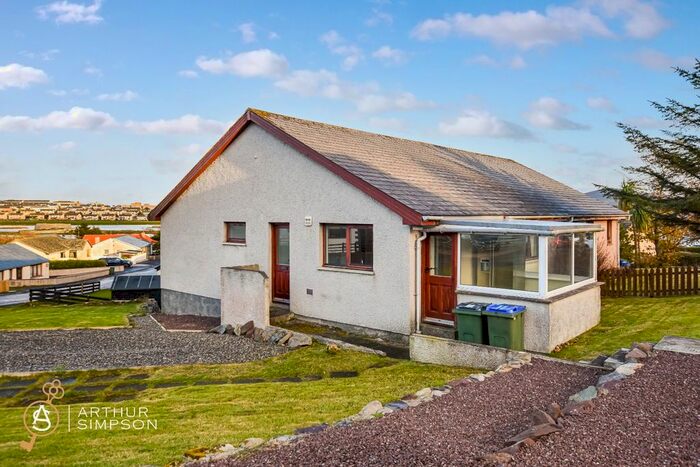
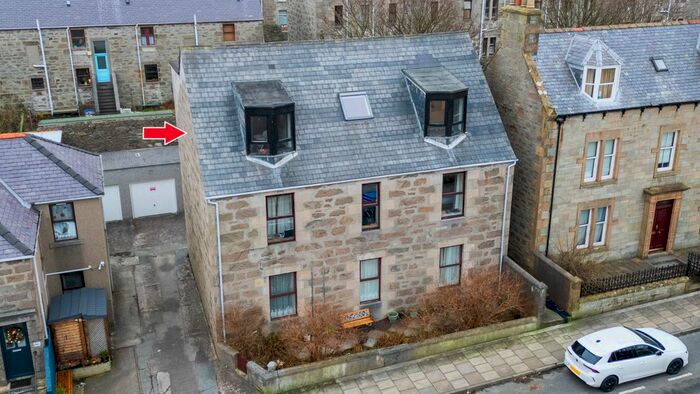
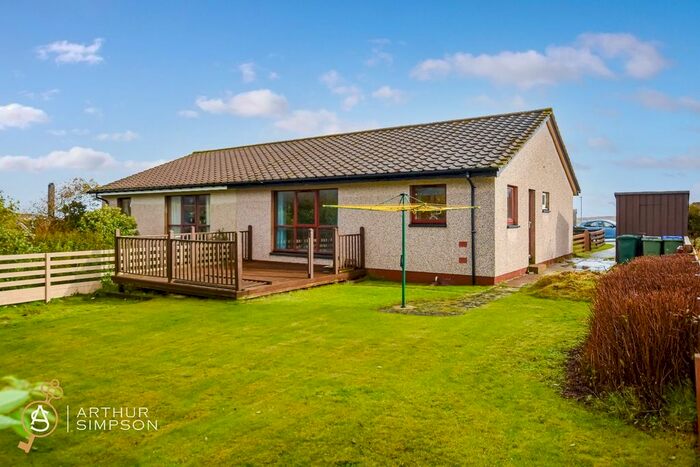
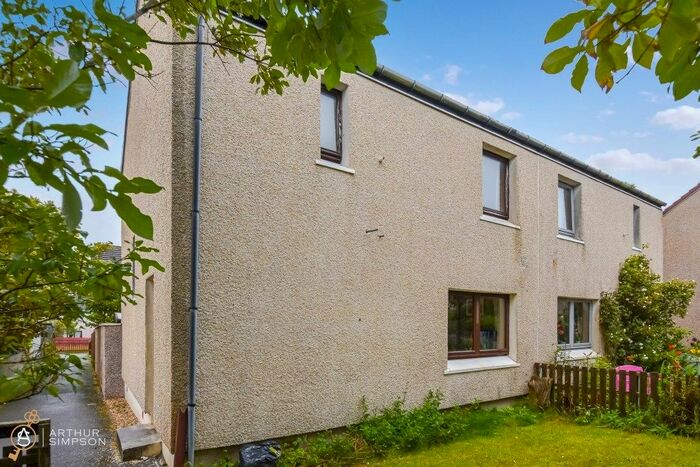
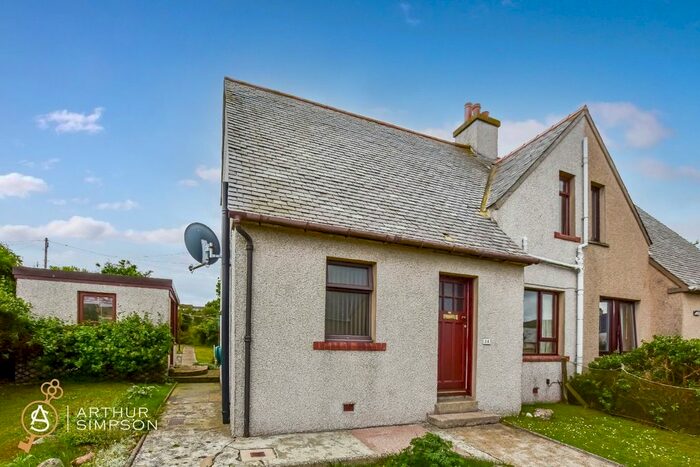
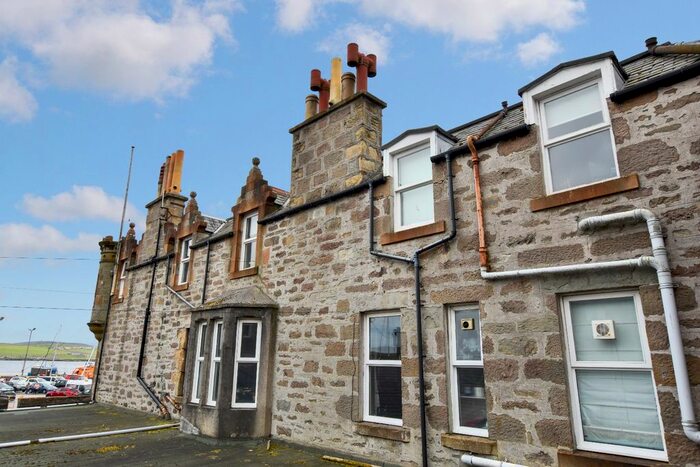
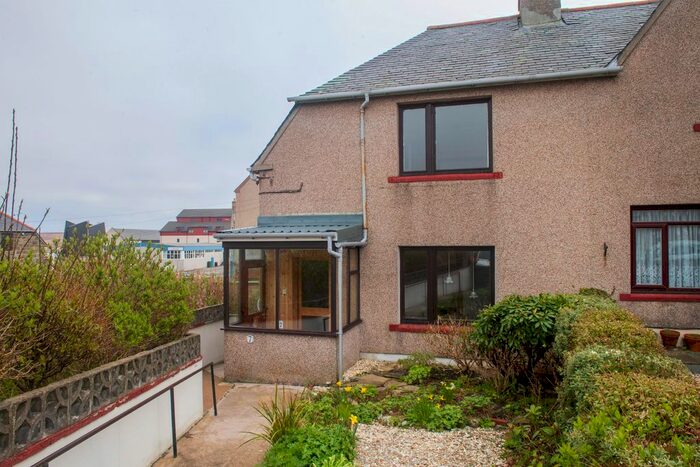
Properties for sale in Lerwick South


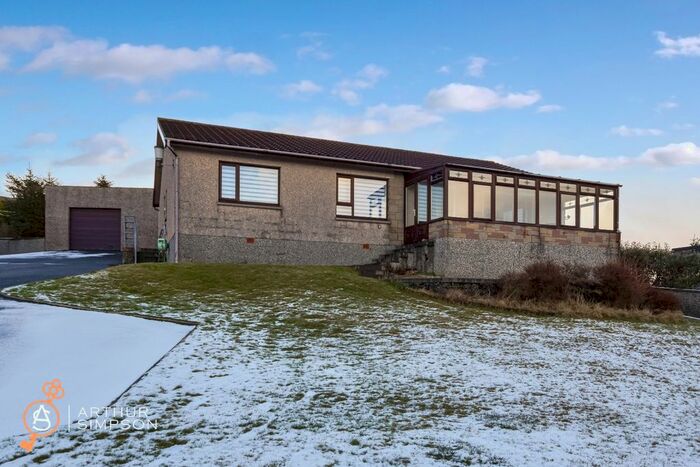
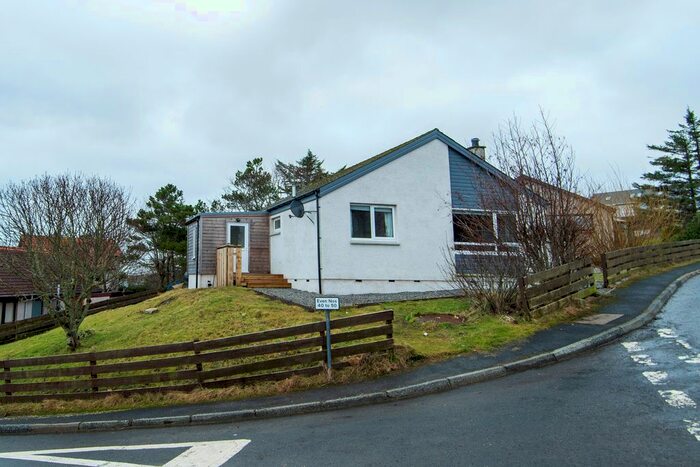
Previously listed properties in Lerwick South


Roads and Postcodes in Lerwick South
Navigate through our locations to find the location of your next house in Lerwick South, Shetland for sale or to rent.
| Streets | Postcodes |
|---|---|
| Ackrigarth | ZE1 0RQ |
| Aisterlea | ZE2 9FN |
| Anderson Homes | ZE1 0BG |
| Andrewstown Brae | ZE1 0RF |
| Andrewstown Terrace | ZE1 0SY |
| Annsbrae Gardens | ZE1 0BU |
| Annsbrae Houses | ZE1 0BP |
| Annsbrae Place | ZE1 0BW |
| Arheim | ZE1 0WY |
| Baila | ZE1 0DH |
| Baila Croft | ZE1 0EY |
| Bakland | ZE1 0SX |
| Bellevue Park | ZE1 0EE |
| Bells Place | ZE1 0NW |
| Bells Road | ZE1 0QB |
| Braefield | ZE1 0SS |
| Breiwick Road | ZE1 0AS ZE1 0AT ZE1 0DB ZE1 0DD |
| Burgh Road | ZE1 0LB |
| Cairnfield Road | ZE1 0QR |
| Central Heathery Park | ZE2 9GE |
| Chromate Lane | ZE1 0AL |
| Clickimin Road | ZE1 0QX |
| Commercial Street | ZE1 0AB ZE1 0AN |
| Fjallberg | ZE1 0WL |
| Fogralea | ZE1 0SE |
| Gilbertson Road | ZE1 0QJ |
| Glenfarquhar | ZE1 0UF |
| Goodlad Crescent | ZE1 0QN |
| Greenfield Place | ZE1 0AQ |
| Greenfield Square | ZE1 0FL |
| Greenrig | ZE1 0AW |
| Gressy Loan | ZE1 0YB |
| Grodians | ZE1 0WT |
| Hayfield Court | ZE1 0WN |
| Hayfield Lane | ZE1 0PL ZE1 0QD |
| Heathery Park | ZE2 9GD |
| Helendale Drive | ZE1 0RZ |
| Helendale Terrace | ZE1 0GE |
| Hillcrest | ZE1 0ST |
| Hillside Brae | ZE2 9FD |
| Hillside Park | ZE2 9FE |
| Hjaltland Place | ZE1 0DU |
| Kantersted Court | ZE1 0GF |
| Kantersted Road | ZE1 0RH ZE1 0RJ |
| King Harald Street | ZE1 0DJ |
| Kirkland | ZE1 0SL |
| Knab Road | ZE1 0AR ZE1 0AX |
| Kveldsro Gardens | ZE1 0AU |
| Leog | ZE1 0AP |
| Leog Lane | ZE1 0AH |
| Leslie Road | ZE1 0QQ |
| Lochend Cottages | ZE1 0FN |
| Longland | ZE1 0SP |
| Lovers Loan | ZE1 0BA |
| Lower Hillside | ZE2 9FG |
| Lower Sound | ZE1 0RL ZE1 0RN |
| Mansefield | ZE1 0YA |
| Midgarth Crescent | ZE1 0BH |
| Millgaet | ZE1 0HG |
| Montfield | ZE1 0QA |
| Montfield Lane | ZE1 0LF |
| Murrayston | ZE1 0RE |
| Nederdale | ZE1 0SA ZE1 0SB |
| Nordavatn | ZE1 0JF |
| North Heathery Park | ZE2 9GF |
| North Loch Drive | ZE1 0GR |
| North Lochside | ZE1 0PJ |
| Observatory | ZE1 0RR |
| Punds | ZE1 0LP |
| Quoys Road | ZE1 0WH |
| Ronald Street | ZE1 0BQ |
| Rudda Court | ZE1 0SD |
| Rudda Park | ZE1 0EF |
| Russell Crescent | ZE1 0QS ZE1 0QT |
| Sands Of Sound | ZE1 0SZ |
| Sandveien | ZE1 0RS ZE1 0RT ZE1 0RU ZE1 0RW ZE1 0RX ZE1 0RY |
| Sandy Loch Drive | ZE1 0SR |
| Scalloway Road | ZE1 0BT ZE1 0LD |
| Sea Road | ZE1 0ZJ |
| Seafield Road | ZE1 0WZ |
| Sletts Park | ZE1 0LN |
| Sletts Road | ZE1 0LJ |
| South Lochside | ZE1 0RA |
| South Road | ZE1 0GY ZE1 0RB ZE1 0RD ZE1 0TB |
| St Olaf Street | ZE1 0BX |
| Stouts Court | ZE1 0AF |
| Sundhamar | ZE1 0WJ |
| Tarland | ZE1 0SJ |
| Thorfinn Street | ZE1 0GQ |
| Twageos Road | ZE1 0BB |
| Upper Baila | ZE1 0SF |
| Upper Sound | ZE1 0LY ZE1 0SU ZE1 0SH ZE1 0SN ZE1 0SQ |
| Water Lane | ZE1 0AG |
| West Baila | ZE1 0SG |
| West Hillcrest | ZE1 0JZ |
| West Sletts Park | ZE1 0QZ |
| Westerloch Brae | ZE1 0GB |
| Westerloch Crescent | ZE1 0RP |
| Westerloch Drive | ZE1 0GD |
| Westerloch Terrace | ZE1 0GA |
| ZE1 0RG ZE2 9EX ZE2 9JX ZE2 9TX |
Transport near Lerwick South
-
 Thurso Station
 -
Wick Station
-
Georgemas Junction Station
-
Scotscalder Station
-
Altnabreac Station
-
Forsinard Station
-
Kinbrace Station
-
Helmsdale Station
-
Kildonan Station
-
Brora Station
- FAQ
- Price Paid By Year
Frequently asked questions about Lerwick South
What is the average price for a property for sale in Lerwick South?
The average price for a property for sale in Lerwick South is £223,740. This amount is 19% higher than the average price in Shetland. There are 83 property listings for sale in Lerwick South.
What streets have the most expensive properties for sale in Lerwick South?
The streets with the most expensive properties for sale in Lerwick South are Quoys Road at an average of £500,500, Punds at an average of £407,000 and Upper Baila at an average of £395,000.
What streets have the most affordable properties for sale in Lerwick South?
The streets with the most affordable properties for sale in Lerwick South are Millgaet at an average of £97,333, Leslie Road at an average of £131,000 and Chromate Lane at an average of £136,833.
Which train stations are available in or near Lerwick South?
Some of the train stations available in or near Lerwick South are Thurso, Wick and Georgemas Junction.
Property Price Paid in Lerwick South by Year
The average sold property price by year was:
| Year | Average Sold Price | Price Change |
Sold Properties
|
|---|---|---|---|
| 2023 | £265,638 | 13% |
8 Properties |
| 2022 | £232,035 | 9% |
53 Properties |
| 2021 | £211,243 | 9% |
62 Properties |
| 2020 | £191,785 | -8% |
38 Properties |
| 2019 | £207,255 | -2% |
51 Properties |
| 2018 | £211,085 | 3% |
56 Properties |
| 2017 | £203,980 | 7% |
65 Properties |
| 2016 | £188,727 | 7% |
41 Properties |
| 2015 | £175,592 | -14% |
51 Properties |
| 2014 | £201,019 | 26% |
45 Properties |
| 2013 | £149,710 | 2% |
52 Properties |
| 2012 | £146,200 | 0,1% |
42 Properties |
| 2011 | £146,058 | 10% |
55 Properties |
| 2010 | £132,089 | 7% |
44 Properties |
| 2009 | £122,906 | 6% |
47 Properties |
| 2008 | £115,362 | -10% |
69 Properties |
| 2007 | £127,171 | 23% |
63 Properties |
| 2006 | £98,292 | -16% |
63 Properties |
| 2005 | £113,700 | 35% |
70 Properties |
| 2004 | £73,452 | -3% |
67 Properties |
| 2003 | £75,629 | 34% |
46 Properties |
| 2002 | £49,690 | 4% |
28 Properties |
| 2001 | £47,808 | -19% |
23 Properties |
| 2000 | £56,735 | - |
11 Properties |