
Houses for sale & to rent in Lanark, South Lanarkshire
House Prices in Lanark
Properties in Lanark have an average house price of £176,537.00 and had 1,445 Property Transactions within the last 3 years.¹
Lanark is an area in South Lanarkshire with 15,262 households², where the most expensive property was sold for £875,000.00.
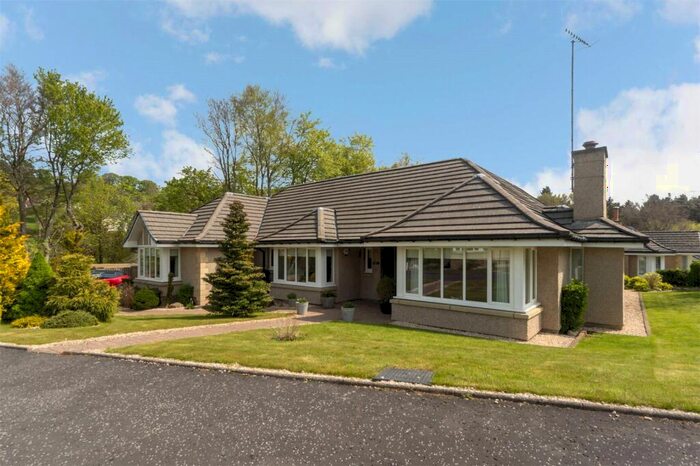
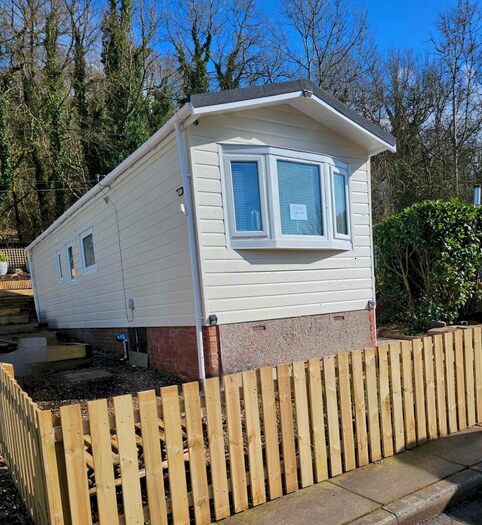
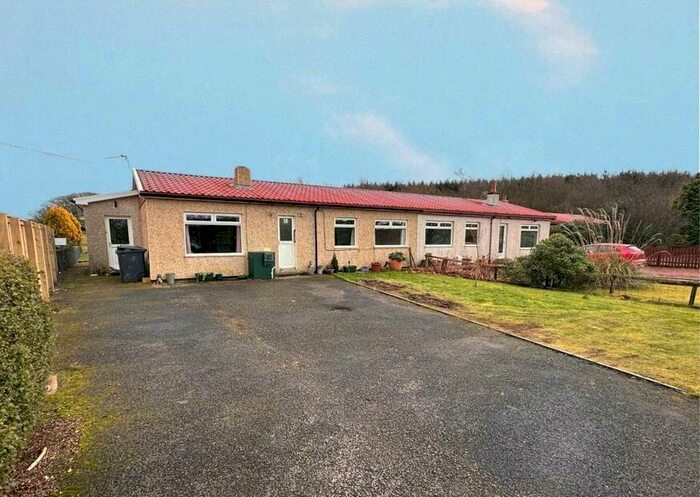
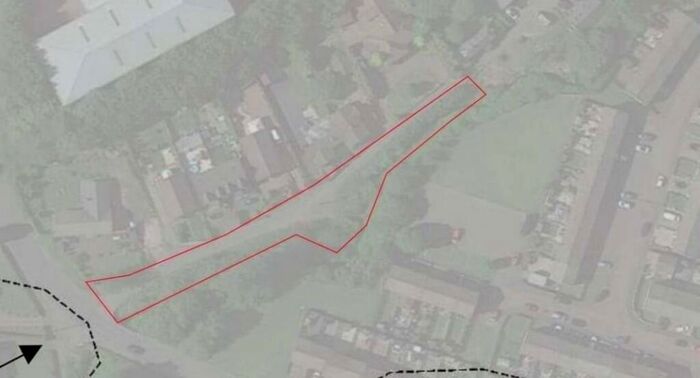
Properties for sale in Lanark


Neighbourhoods in Lanark
Navigate through our locations to find the location of your next house in Lanark, South Lanarkshire for sale or to rent.
Transport in Lanark
Please see below transportation links in this area:

- FAQ
- Price Paid By Year
Frequently asked questions about Lanark
What is the average price for a property for sale in Lanark?
The average price for a property for sale in Lanark is £176,537. This amount is 0.4% lower than the average price in South Lanarkshire. There are more than 10,000 property listings for sale in Lanark.
What locations have the most expensive properties for sale in Lanark?
The locations with the most expensive properties for sale in Lanark are Clydesdale East at an average of £201,884 and Clydesdale North at an average of £179,928.
What locations have the most affordable properties for sale in Lanark?
The location with the most affordable properties for sale in Lanark is Clydesdale South at an average of £164,521.
Which train stations are available in or near Lanark?
Some of the train stations available in or near Lanark are Lanark, Carstairs and Carluke.
Property Price Paid in Lanark by Year
The average sold property price by year was:
| Year | Average Sold Price | Price Change |
Sold Properties
|
|---|---|---|---|
| 2023 | £183,475 | -2% |
115 Properties |
| 2022 | £186,314 | 10% |
606 Properties |
| 2021 | £167,252 | 7% |
724 Properties |
| 2020 | £155,916 | 9% |
571 Properties |
| 2019 | £142,007 | 4% |
667 Properties |
| 2018 | £136,804 | 2% |
582 Properties |
| 2017 | £134,112 | 4% |
532 Properties |
| 2016 | £128,804 | 0,4% |
597 Properties |
| 2015 | £128,330 | 5% |
542 Properties |
| 2014 | £121,325 | -3% |
535 Properties |
| 2013 | £124,838 | -4% |
453 Properties |
| 2012 | £129,332 | 1% |
426 Properties |
| 2011 | £127,609 | -8% |
416 Properties |
| 2010 | £137,909 | -2% |
428 Properties |
| 2009 | £140,014 | -113% |
411 Properties |
| 2008 | £298,577 | 54% |
575 Properties |
| 2007 | £137,974 | 14% |
762 Properties |
| 2006 | £119,003 | 17% |
782 Properties |
| 2005 | £98,389 | 10% |
656 Properties |
| 2004 | £88,570 | 30% |
661 Properties |
| 2003 | £62,211 | 7% |
670 Properties |
| 2002 | £57,903 | 21% |
657 Properties |
| 2001 | £45,950 | - |
57 Properties |