
Houses for sale & to rent in Bargoed, Caerffili - Caerphilly
House Prices in Bargoed
Properties in Bargoed have an average house price of £132,242.00 and had 621 Property Transactions within the last 3 years.¹
Bargoed is an area in Caerffili - Caerphilly with 6,917 households², where the most expensive property was sold for £540,000.00.
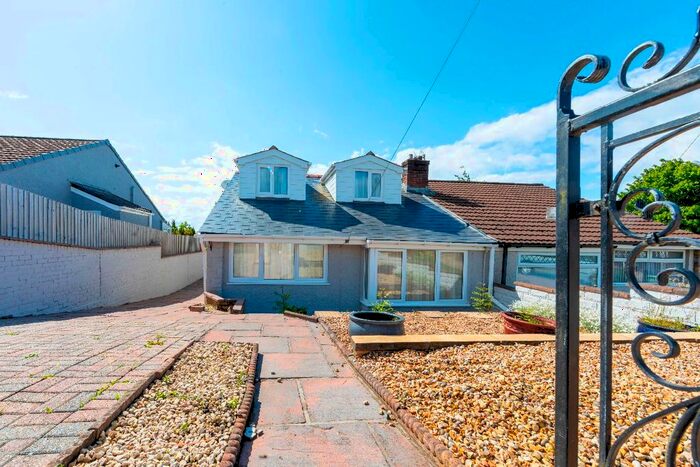
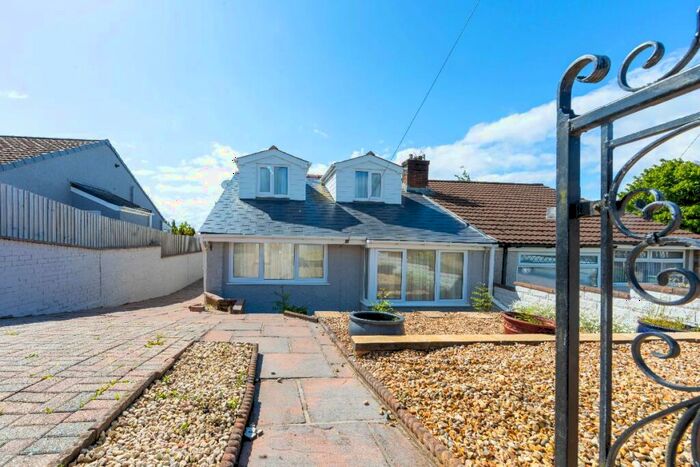
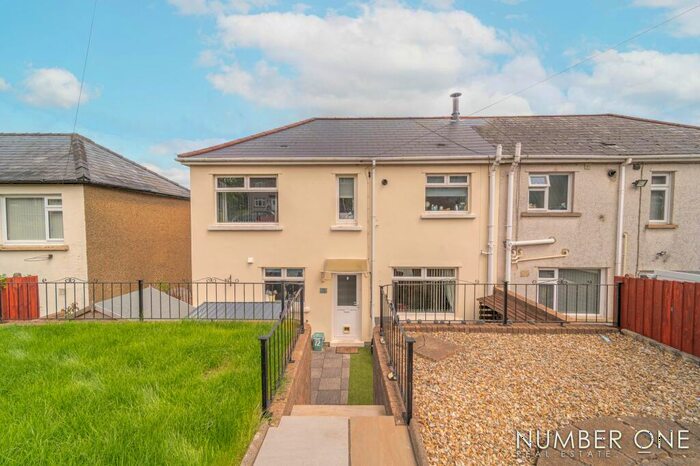
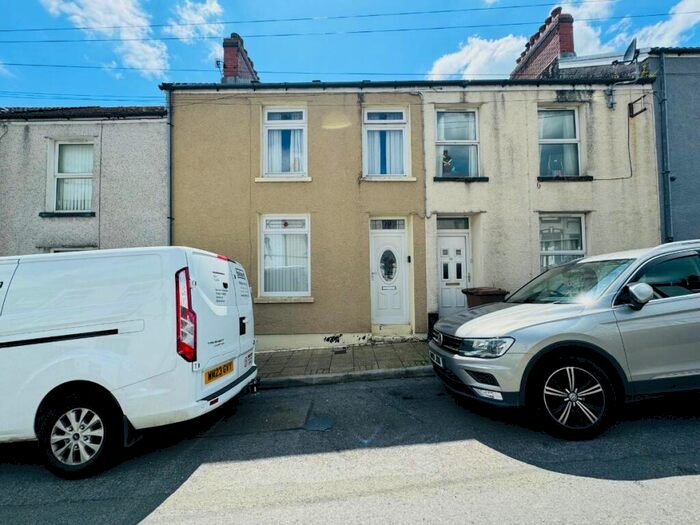
Properties for sale in Bargoed


Neighbourhoods in Bargoed
Navigate through our locations to find the location of your next house in Bargoed, Caerffili - Caerphilly for sale or to rent.
Transport in Bargoed
Please see below transportation links in this area:

- FAQ
- Price Paid By Year
- Property Type Price
Frequently asked questions about Bargoed
What is the average price for a property for sale in Bargoed?
The average price for a property for sale in Bargoed is £132,242. This amount is 31% lower than the average price in Caerffili - Caerphilly. There are 2,288 property listings for sale in Bargoed.
What locations have the most expensive properties for sale in Bargoed?
The locations with the most expensive properties for sale in Bargoed are Aberbargoed at an average of £161,409, Gilfach at an average of £138,472 and Bargoed at an average of £124,656.
What locations have the most affordable properties for sale in Bargoed?
The locations with the most affordable properties for sale in Bargoed are Darren Valley at an average of £106,249 and Pontlottyn at an average of £114,869.
Which train stations are available in or near Bargoed?
Some of the train stations available in or near Bargoed are Brithdir, Bargoed and Tir-Phil.
Property Price Paid in Bargoed by Year
The average sold property price by year was:
| Year | Average Sold Price | Price Change |
Sold Properties
|
|---|---|---|---|
| 2024 | £134,100 | -4% |
5 Properties |
| 2023 | £139,288 | 5% |
151 Properties |
| 2022 | £132,420 | 4% |
223 Properties |
| 2021 | £127,644 | 3% |
242 Properties |
| 2020 | £124,022 | 18% |
212 Properties |
| 2019 | £102,307 | 11% |
215 Properties |
| 2018 | £91,249 | -3% |
182 Properties |
| 2017 | £93,626 | 7% |
196 Properties |
| 2016 | £87,167 | -0,1% |
180 Properties |
| 2015 | £87,224 | -11% |
179 Properties |
| 2014 | £97,001 | 19% |
176 Properties |
| 2013 | £78,603 | -2% |
125 Properties |
| 2012 | £80,494 | -0,1% |
112 Properties |
| 2011 | £80,610 | 0,3% |
108 Properties |
| 2010 | £80,356 | 11% |
120 Properties |
| 2009 | £71,740 | -37% |
82 Properties |
| 2008 | £98,089 | 0,3% |
182 Properties |
| 2007 | £97,798 | 9% |
260 Properties |
| 2006 | £88,829 | 9% |
223 Properties |
| 2005 | £80,432 | 12% |
226 Properties |
| 2004 | £70,528 | 27% |
248 Properties |
| 2003 | £51,176 | 25% |
245 Properties |
| 2002 | £38,559 | 2% |
267 Properties |
| 2001 | £37,646 | 1% |
212 Properties |
| 2000 | £37,224 | -6% |
197 Properties |
| 1999 | £39,341 | 10% |
206 Properties |
| 1998 | £35,407 | 16% |
157 Properties |
| 1997 | £29,733 | 1% |
121 Properties |
| 1996 | £29,300 | 3% |
124 Properties |
| 1995 | £28,462 | - |
140 Properties |
Property Price per Property Type in Bargoed
Here you can find historic sold price data in order to help with your property search.
The average Property Paid Price for specific property types in the last three years are:
| Property Type | Average Sold Price | Sold Properties |
|---|---|---|
| Semi Detached House | £144,753.00 | 130 Semi Detached Houses |
| Terraced House | £113,892.00 | 417 Terraced Houses |
| Detached House | £248,384.00 | 59 Detached Houses |
| Flat | £77,130.00 | 15 Flats |