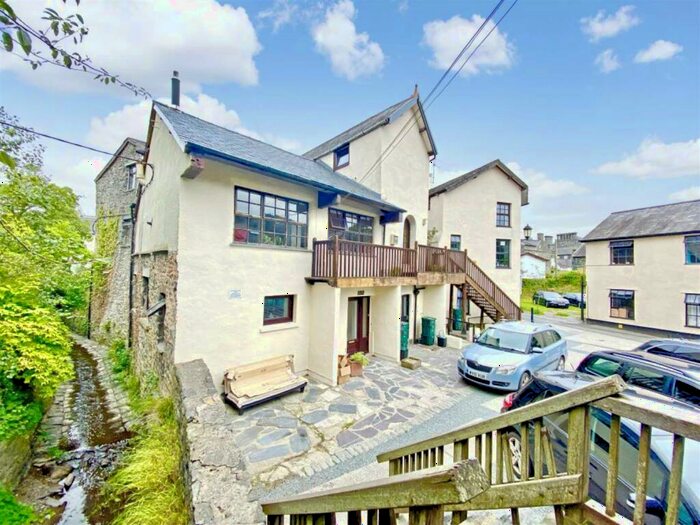
Houses for sale & to rent in Gower, Llanrwst
House Prices in Gower
Properties in Gower have an average house price of £188,975.00 and had 35 Property Transactions within the last 3 years¹.
Gower is an area in Llanrwst, Conwy - Conwy with 477 households², where the most expensive property was sold for £370,000.00.
Properties for sale in Gower
Roads and Postcodes in Gower
Navigate through our locations to find the location of your next house in Gower, Llanrwst for sale or to rent.
| Streets | Postcodes |
|---|---|
| Cae Llan | LL26 0DH |
| Cae Tyddyn | LL26 0BL LL26 0BN |
| Caer Felin | LL26 0BH |
| Carrington Terrace | LL26 0EB |
| George Street | LL26 0DP |
| Glanrafon | LL26 0DL |
| John Street | LL26 0DR |
| Llanddoged Road | LL26 0DW LL26 0YU LL26 0YT |
| Llanddoget Road | LL26 0YS |
| Parry Road | LL26 0DG |
| Pen Y Bryn | LL26 0DT |
| Poplar Grove | LL26 0ED LL26 0EE |
| Railway Terrace | LL26 0EA |
| Salisbury Terrace | LL26 0DU |
| Station Road | LL26 0BT LL26 0DB LL26 0DS LL26 0EH LL26 0BU LL26 0DA LL26 0DF |
| Station Terrace | LL26 0EG |
| Talybont Road | LL26 0AU |
| Talycafn Road | LL26 0EF |
| LL26 0YY LL24 0ZF LL26 0BD LL26 0DN LL26 0ZA LL26 0ZF LL26 9AG LL26 9ZZ |
Transport near Gower
- FAQ
- Price Paid By Year
- Property Type Price
Frequently asked questions about Gower
What is the average price for a property for sale in Gower?
The average price for a property for sale in Gower is £188,975. This amount is 18% lower than the average price in Llanrwst. There are 128 property listings for sale in Gower.
What streets have the most expensive properties for sale in Gower?
The streets with the most expensive properties for sale in Gower are Pen Y Bryn at an average of £344,000, Poplar Grove at an average of £280,000 and Station Road at an average of £230,833.
What streets have the most affordable properties for sale in Gower?
The streets with the most affordable properties for sale in Gower are Salisbury Terrace at an average of £130,000, George Street at an average of £140,000 and Caer Felin at an average of £154,975.
Which train stations are available in or near Gower?
Some of the train stations available in or near Gower are North Llanrwst, Llanrwst and Dolgarrog.
Property Price Paid in Gower by Year
The average sold property price by year was:
| Year | Average Sold Price | Price Change |
Sold Properties
|
|---|---|---|---|
| 2024 | £144,000 | -53% |
1 Property |
| 2023 | £219,875 | 27% |
8 Properties |
| 2022 | £161,361 | -19% |
9 Properties |
| 2021 | £191,700 | 27% |
17 Properties |
| 2020 | £140,450 | -20% |
10 Properties |
| 2019 | £169,111 | 6% |
13 Properties |
| 2018 | £158,408 | -14% |
6 Properties |
| 2017 | £180,434 | 10% |
19 Properties |
| 2016 | £162,708 | 28% |
12 Properties |
| 2015 | £117,871 | -14% |
16 Properties |
| 2014 | £133,810 | -13% |
20 Properties |
| 2013 | £151,694 | 27% |
18 Properties |
| 2012 | £110,250 | -21% |
6 Properties |
| 2011 | £133,812 | -27% |
8 Properties |
| 2010 | £169,777 | 44% |
9 Properties |
| 2009 | £95,166 | -8% |
6 Properties |
| 2008 | £102,850 | -72% |
10 Properties |
| 2007 | £177,008 | 18% |
17 Properties |
| 2006 | £145,250 | 26% |
18 Properties |
| 2005 | £107,329 | 6% |
12 Properties |
| 2004 | £100,542 | 14% |
21 Properties |
| 2003 | £86,507 | 38% |
14 Properties |
| 2002 | £54,055 | 5% |
14 Properties |
| 2001 | £51,231 | 20% |
27 Properties |
| 2000 | £40,983 | -12% |
14 Properties |
| 1999 | £45,892 | 13% |
7 Properties |
| 1998 | £39,833 | 3% |
12 Properties |
| 1997 | £38,591 | -7% |
12 Properties |
| 1996 | £41,361 | -16% |
18 Properties |
| 1995 | £47,812 | - |
8 Properties |
Property Price per Property Type in Gower
Here you can find historic sold price data in order to help with your property search.
The average Property Paid Price for specific property types in the last three years are:
| Property Type | Average Sold Price | Sold Properties |
|---|---|---|
| Semi Detached House | £220,395.00 | 10 Semi Detached Houses |
| Terraced House | £146,494.00 | 17 Terraced Houses |
| Detached House | £239,975.00 | 8 Detached Houses |


