
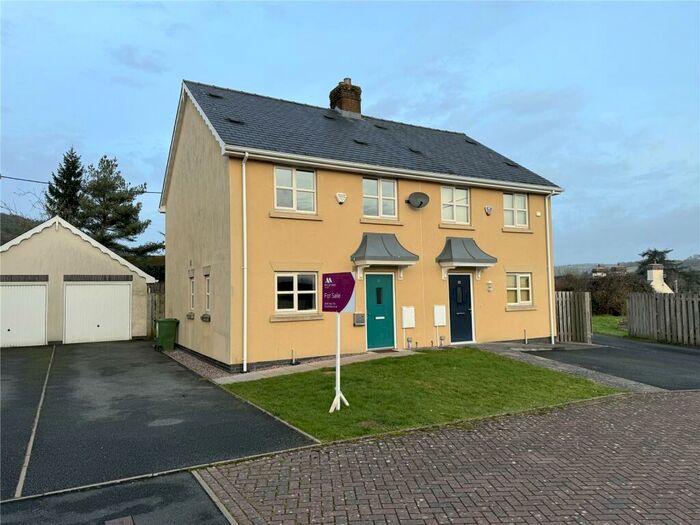
Houses for sale & to rent in Glasbury, Brecon
House Prices in Glasbury
Properties in Glasbury have an average house price of £386,376.00 and had 15 Property Transactions within the last 3 years¹.
Glasbury is an area in Brecon, Powys - Powys with 190 households², where the most expensive property was sold for £757,500.00.
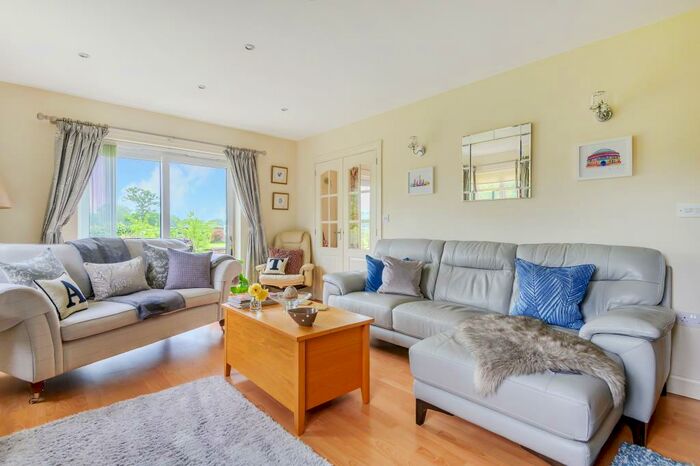
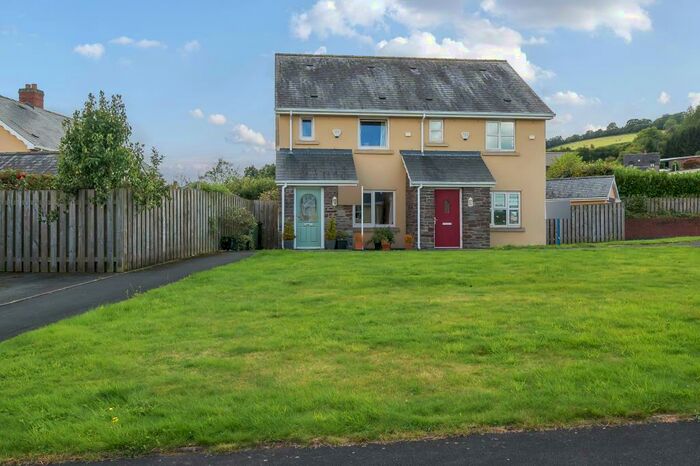
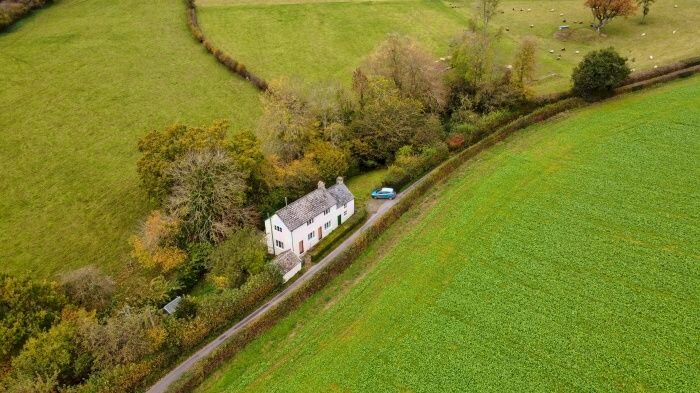
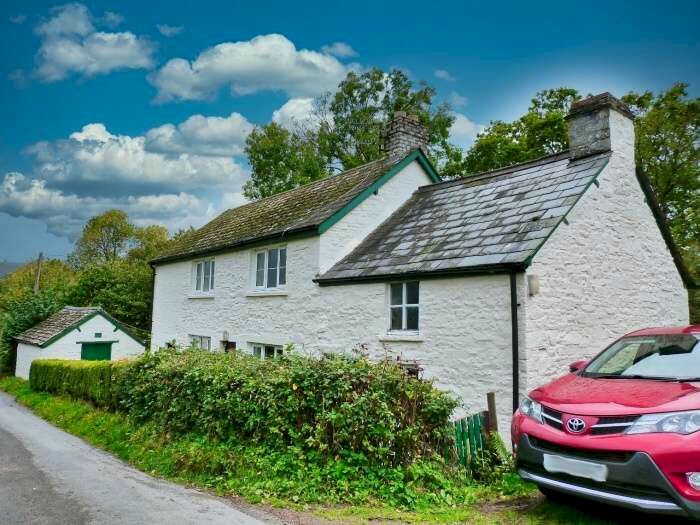
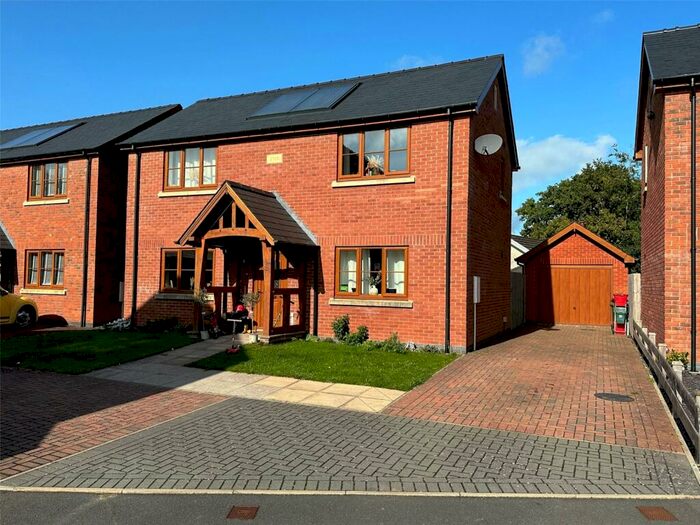
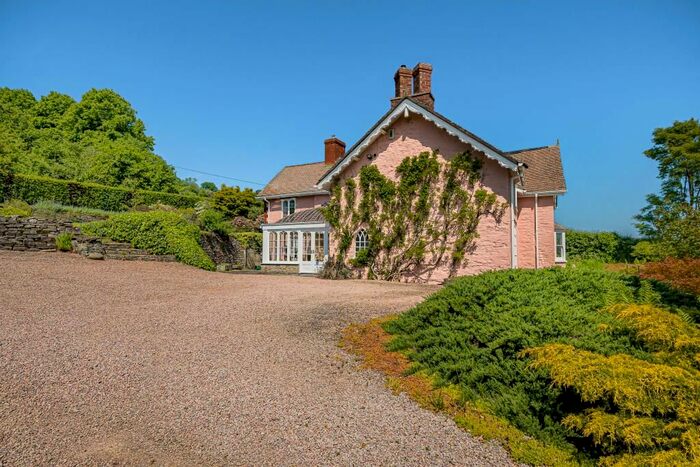
Properties for sale in Glasbury


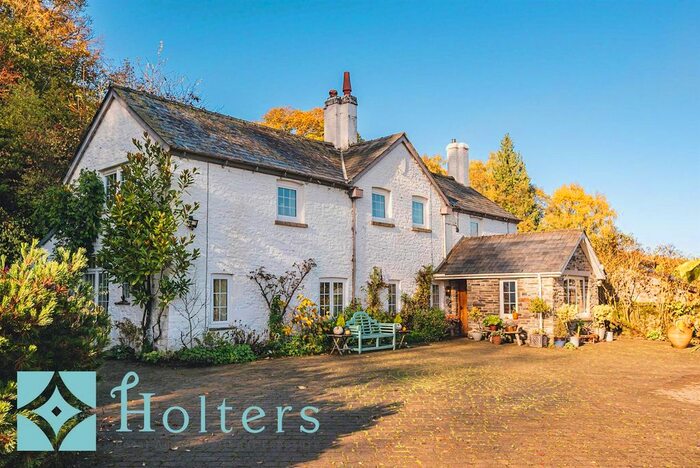
Previously listed properties in Glasbury


Roads and Postcodes in Glasbury
Navigate through our locations to find the location of your next house in Glasbury, Brecon for sale or to rent.
| Streets | Postcodes |
|---|---|
| Beeches Park | LD3 0YJ |
| Church Close | LD3 0DJ |
| Cwrt Y Gaer | LD3 0YX |
| Harolds Field | LD3 0YQ |
| Mill Row | LD3 0YD |
| River View Close | LD3 0YZ |
| Springfield Cottage | LD3 0YT |
| Station Road | LD3 0YF |
| Woodlands View | LD3 0TH |
| LD3 0BJ LD3 0BQ LD3 0BX LD3 0BZ LD3 0YG LD3 0YH LD3 0YR LD3 0AJ LD3 0AQ LD3 0AX LD3 0AZ LD3 0LQ LD3 0YL LD3 0YS LD3 0YU LD3 0YY |
Transport near Glasbury

- FAQ
- Price Paid By Year
- Property Type Price
Frequently asked questions about Glasbury
What is the average price for a property for sale in Glasbury?
The average price for a property for sale in Glasbury is £386,376. This amount is 29% higher than the average price in Brecon. There are 46 property listings for sale in Glasbury.
What streets have the most expensive properties for sale in Glasbury?
The streets with the most expensive properties for sale in Glasbury are Church Close at an average of £555,000 and Station Road at an average of £360,000.
What streets have the most affordable properties for sale in Glasbury?
The street with the most affordable properties for sale in Glasbury is Beeches Park at an average of £271,440.
Which train stations are available in or near Glasbury?
Some of the train stations available in or near Glasbury are Cilmeri, Builth Road and Garth (Powys).
Property Price Paid in Glasbury by Year
The average sold property price by year was:
| Year | Average Sold Price | Price Change |
Sold Properties
|
|---|---|---|---|
| 2023 | £396,666 | -53% |
3 Properties |
| 2022 | £606,666 | 49% |
3 Properties |
| 2021 | £309,516 | 15% |
9 Properties |
| 2020 | £263,125 | -11% |
8 Properties |
| 2019 | £292,666 | -2% |
9 Properties |
| 2018 | £299,285 | 22% |
7 Properties |
| 2017 | £234,227 | 1% |
11 Properties |
| 2016 | £230,928 | 10% |
14 Properties |
| 2015 | £208,250 | -21% |
8 Properties |
| 2014 | £252,666 | 14% |
6 Properties |
| 2013 | £218,222 | 27% |
9 Properties |
| 2012 | £160,000 | -5% |
1 Property |
| 2011 | £168,333 | -48% |
3 Properties |
| 2010 | £248,699 | 11% |
5 Properties |
| 2009 | £221,250 | -134% |
4 Properties |
| 2008 | £518,333 | 54% |
3 Properties |
| 2007 | £238,310 | 0,1% |
7 Properties |
| 2006 | £238,027 | 3% |
9 Properties |
| 2005 | £230,816 | 30% |
3 Properties |
| 2004 | £162,083 | -30% |
6 Properties |
| 2003 | £210,150 | -10% |
10 Properties |
| 2002 | £232,200 | 44% |
5 Properties |
| 2001 | £129,230 | 25% |
10 Properties |
| 2000 | £96,357 | 4% |
7 Properties |
| 1999 | £92,416 | 22% |
6 Properties |
| 1998 | £72,483 | -5% |
3 Properties |
| 1997 | £76,000 | 16% |
1 Property |
| 1996 | £63,714 | 8% |
7 Properties |
| 1995 | £58,900 | - |
5 Properties |
Property Price per Property Type in Glasbury
Here you can find historic sold price data in order to help with your property search.
The average Property Paid Price for specific property types in the last three years are:
| Property Type | Average Sold Price | Sold Properties |
|---|---|---|
| Detached House | £432,058.00 | 12 Detached Houses |
| Semi Detached House | £203,650.00 | 3 Semi Detached Houses |