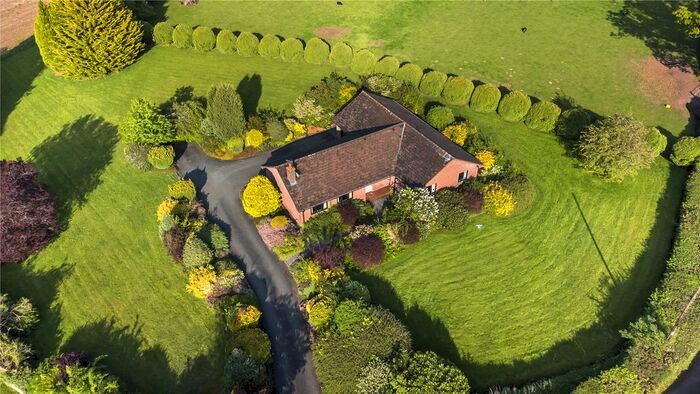
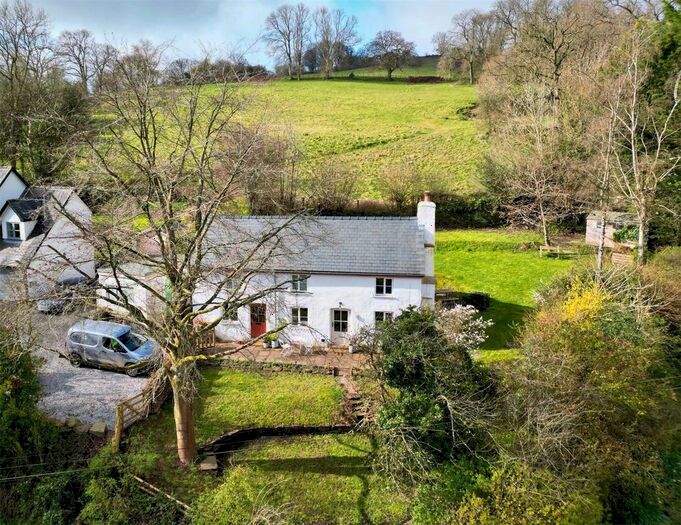
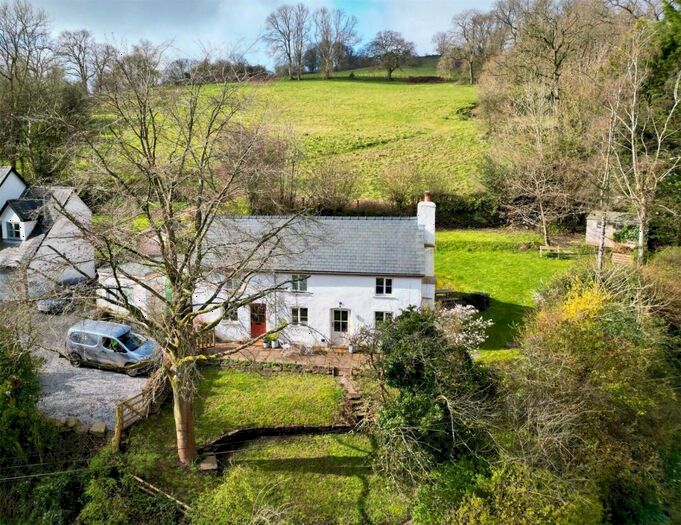
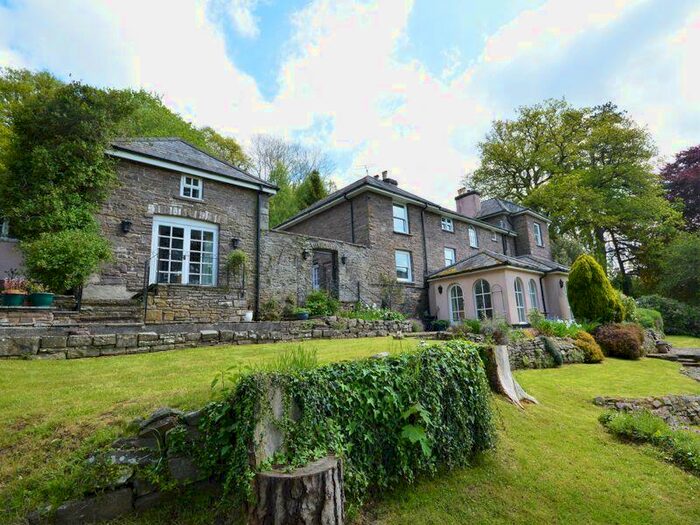
Houses for sale & to rent in Llangors, Brecon
House Prices in Llangors
Properties in Llangors have an average house price of £385,241.00 and had 29 Property Transactions within the last 3 years¹.
Llangors is an area in Brecon, Powys - Powys with 438 households², where the most expensive property was sold for £1,025,000.00.
Properties for sale in Llangors
Roads and Postcodes in Llangors
Navigate through our locations to find the location of your next house in Llangors, Brecon for sale or to rent.
| Streets | Postcodes |
|---|---|
| Berllan Deg | LD3 7TF |
| Cobbstown | LD3 7TA |
| Dol Pistyll | LD3 7TJ |
| Griffin Terrace | LD3 7TD |
| Heoldraw Cottage | LD3 7TT |
| Lake View Close | LD3 7US |
| Maesyfelin | LD3 7TS |
| Meadow View | LD3 7TX |
| Northfield | LD3 7EX |
| Pen Y Brenin | LD3 7FF |
| Powells Cottage | LD3 7UE |
| Rockfield Terrace | LD3 7TB |
| Tai Canol | LD3 7UR |
| Treberfydd Cottage | LD3 7PX |
| LD3 0PS LD3 0RP LD3 0TL LD3 7EJ LD3 7EZ LD3 7SY LD3 7SZ LD3 7TE LD3 7TG LD3 7TH LD3 7TL LD3 7TR LD3 7TW LD3 7TY LD3 7UA LD3 7UB LD3 7UD LD3 7UG LD3 7UL LD3 7UN LD3 7UP LD3 0TN LD3 0TW LD3 7PJ LD3 7PQ LD3 7TN LD3 7TP LD3 7TQ LD3 7TU LD3 7UH LD3 7UU LD3 7UW |
Transport near Llangors
-
Ebbw Vale Town Station
-
Rhymney Station
-
Ebbw Vale Parkway Station
-
Pontlottyn Station
-
Merthyr Tydfil Station
-
Abergavenny Station
- FAQ
- Price Paid By Year
- Property Type Price
Frequently asked questions about Llangors
What is the average price for a property for sale in Llangors?
The average price for a property for sale in Llangors is £385,241. This amount is 28% higher than the average price in Brecon. There are 124 property listings for sale in Llangors.
What streets have the most expensive properties for sale in Llangors?
The streets with the most expensive properties for sale in Llangors are Dol Pistyll at an average of £655,000, Meadow View at an average of £355,000 and Pen Y Brenin at an average of £309,166.
What streets have the most affordable properties for sale in Llangors?
The streets with the most affordable properties for sale in Llangors are Powells Cottage at an average of £205,000 and Berllan Deg at an average of £227,500.
Which train stations are available in or near Llangors?
Some of the train stations available in or near Llangors are Ebbw Vale Town, Rhymney and Ebbw Vale Parkway.
Property Price Paid in Llangors by Year
The average sold property price by year was:
| Year | Average Sold Price | Price Change |
Sold Properties
|
|---|---|---|---|
| 2023 | £210,000 | -117% |
2 Properties |
| 2022 | £456,384 | 25% |
13 Properties |
| 2021 | £344,214 | 12% |
14 Properties |
| 2020 | £302,614 | 20% |
7 Properties |
| 2019 | £240,625 | -27% |
8 Properties |
| 2018 | £305,852 | 28% |
24 Properties |
| 2017 | £221,558 | -21% |
12 Properties |
| 2016 | £267,474 | 10% |
7 Properties |
| 2015 | £241,555 | 1% |
9 Properties |
| 2014 | £239,495 | -22% |
10 Properties |
| 2013 | £293,090 | 18% |
11 Properties |
| 2012 | £241,428 | -20% |
7 Properties |
| 2011 | £289,384 | 10% |
13 Properties |
| 2010 | £261,050 | -11% |
10 Properties |
| 2009 | £290,054 | 8% |
11 Properties |
| 2008 | £267,785 | -20% |
7 Properties |
| 2007 | £320,750 | 18% |
11 Properties |
| 2006 | £264,500 | 20% |
9 Properties |
| 2005 | £212,250 | 7% |
12 Properties |
| 2004 | £197,125 | 11% |
12 Properties |
| 2003 | £176,115 | 5% |
13 Properties |
| 2002 | £167,375 | 23% |
8 Properties |
| 2001 | £128,495 | -7% |
12 Properties |
| 2000 | £137,161 | 33% |
9 Properties |
| 1999 | £91,419 | -14% |
13 Properties |
| 1998 | £104,500 | 2% |
8 Properties |
| 1997 | £102,500 | 22% |
14 Properties |
| 1996 | £80,187 | -34% |
12 Properties |
| 1995 | £107,083 | - |
12 Properties |
Property Price per Property Type in Llangors
Here you can find historic sold price data in order to help with your property search.
The average Property Paid Price for specific property types in the last three years are:
| Property Type | Average Sold Price | Sold Properties |
|---|---|---|
| Terraced House | £316,071.00 | 7 Terraced Houses |
| Semi Detached House | £240,000.00 | 4 Semi Detached Houses |
| Detached House | £444,416.00 | 18 Detached Houses |


