
Houses for sale & to rent in Llanbrynmair, Llanbrynmair
House Prices in Llanbrynmair
Properties in Llanbrynmair have an average house price of £314,820.00 and had 34 Property Transactions within the last 3 years¹.
Llanbrynmair is an area in Llanbrynmair, Powys - Powys with 397 households², where the most expensive property was sold for £814,998.00.
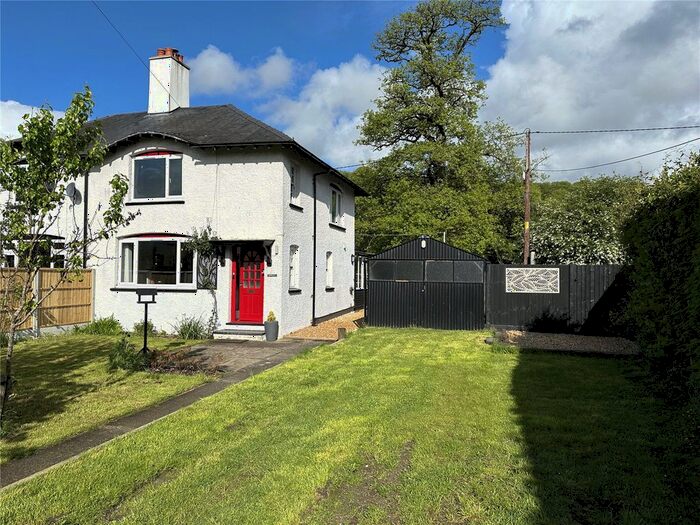
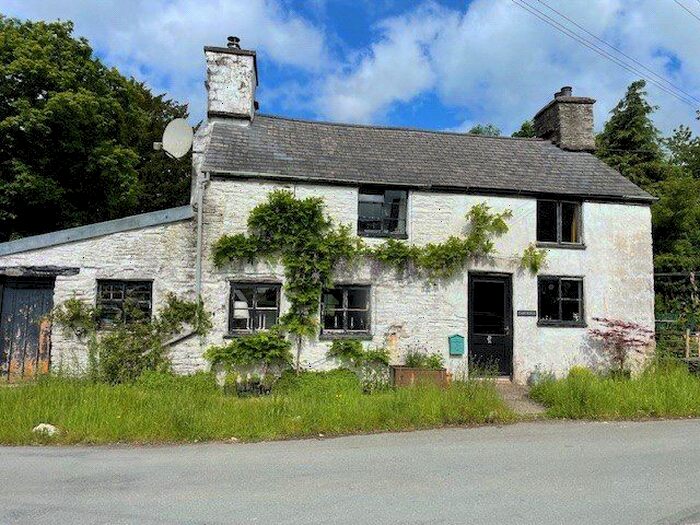
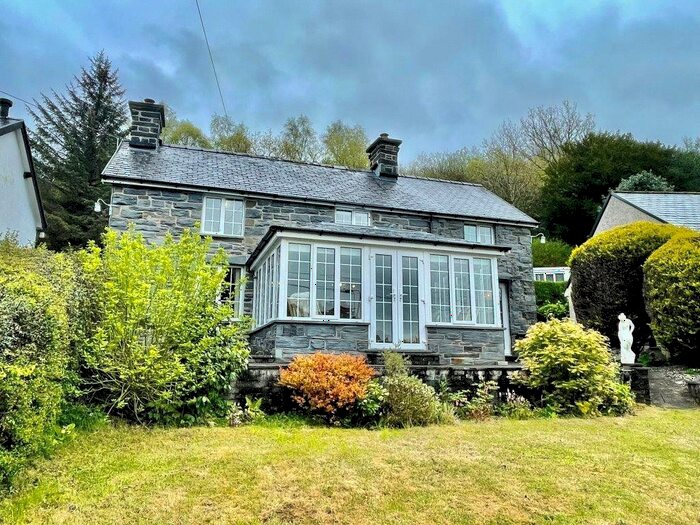
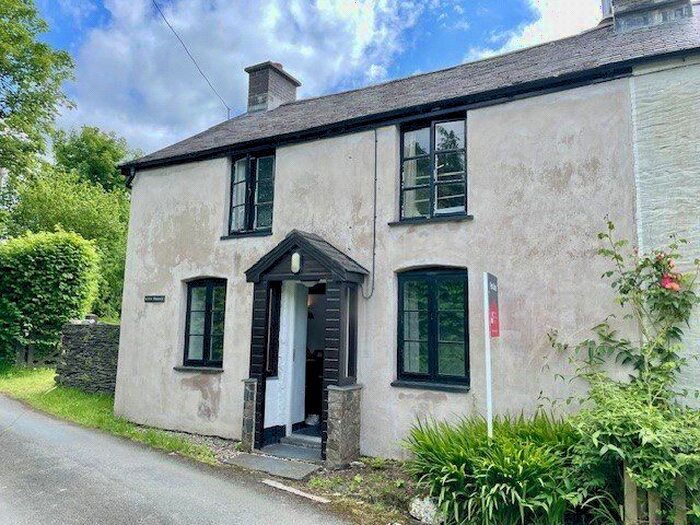
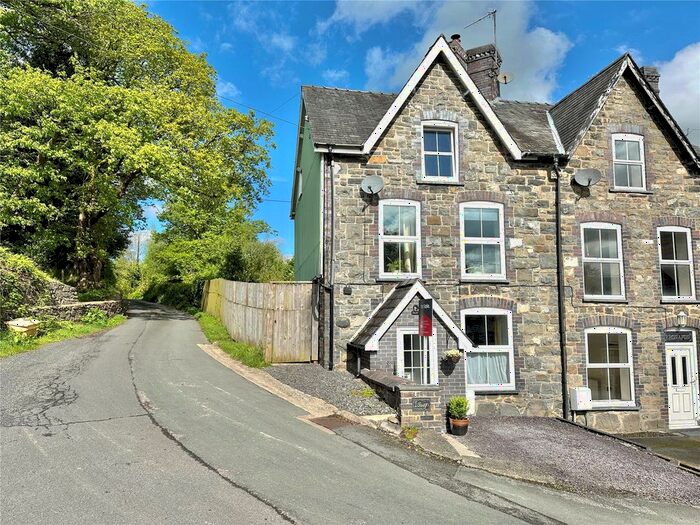
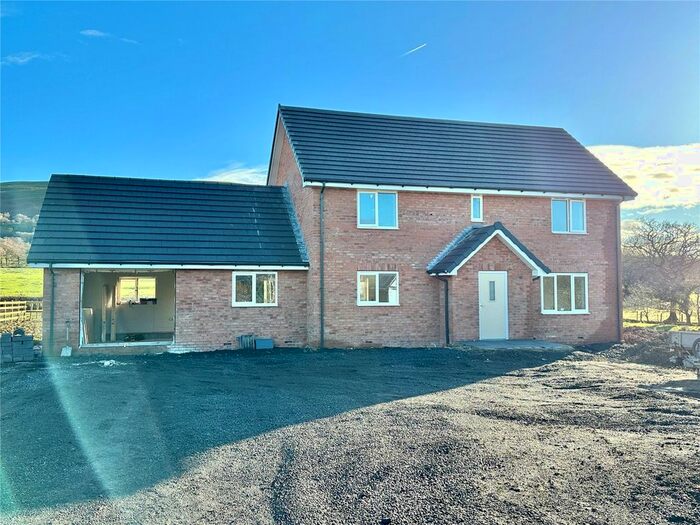
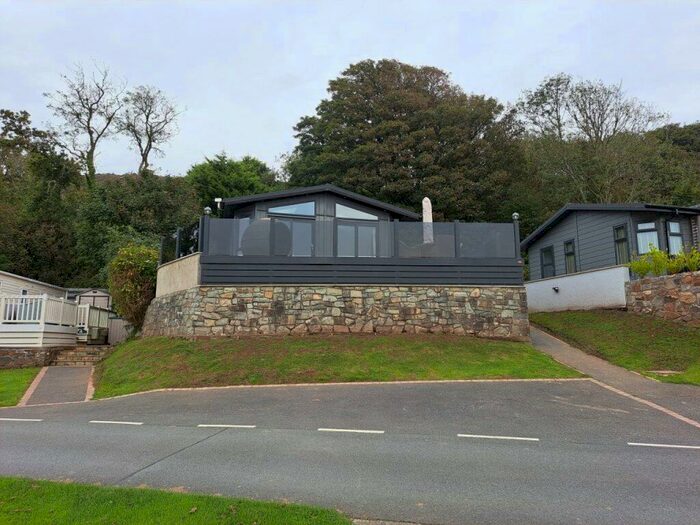
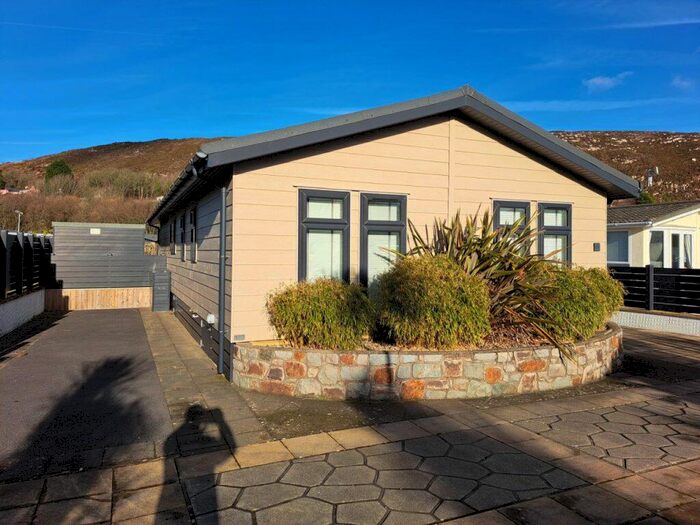
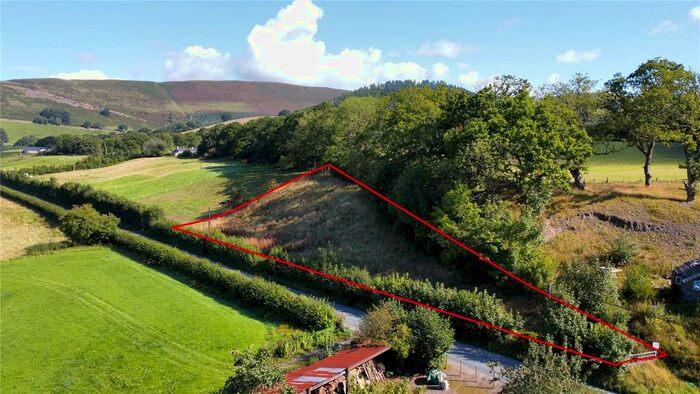
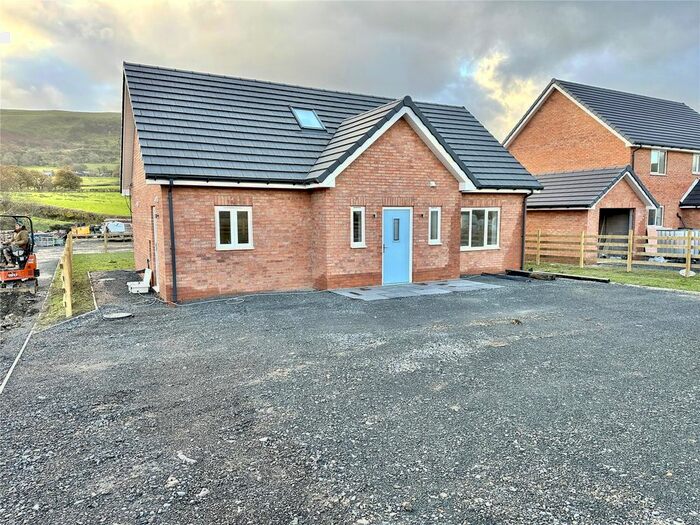
Properties for sale in Llanbrynmair


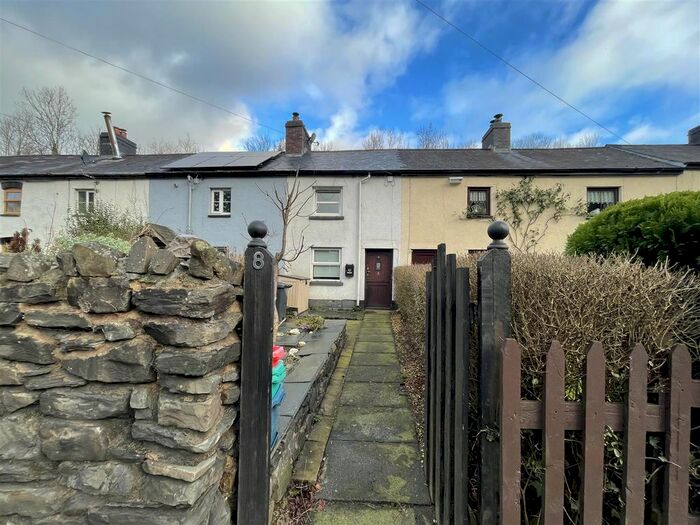

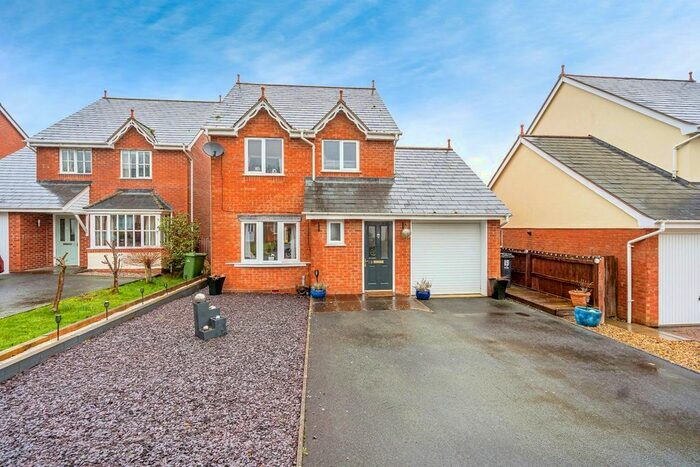


Previously listed properties in Llanbrynmair


Roads and Postcodes in Llanbrynmair
Navigate through our locations to find the location of your next house in Llanbrynmair, Llanbrynmair for sale or to rent.
| Streets | Postcodes |
|---|---|
| Brynderwen | SY19 7AG |
| Dolfach | SY19 7AF |
| Glanclegyr | SY19 7DH |
| Green Villas | SY19 7BD |
| Maes Y Dderwen | SY19 7DQ |
| Maes Yr Efail | SY19 7DA |
| Penddol | SY19 7AD |
| Rock Terrace | SY19 7DW |
| Tawelfan | SY19 7DP |
| SY19 7AA SY19 7AB SY19 7AJ SY19 7AL SY19 7AP SY19 7AR SY19 7AT SY19 7AW SY19 7BB SY19 7BH SY19 7BJ SY19 7BL SY19 7BW SY19 7DD SY19 7DJ SY19 7DL SY19 7DS SY19 7DT SY19 7DU SY19 7DY SY19 7EA SY19 7AE SY19 7AH SY19 7AQ SY19 7AS SY19 7BA SY19 7BE SY19 7BG SY19 7BN SY19 7BP SY19 7BQ SY19 7DN SY19 7DR SY19 7DX SY19 7DZ SY19 7EB SY20 9HS |
Transport near Llanbrynmair

- FAQ
- Price Paid By Year
- Property Type Price
Frequently asked questions about Llanbrynmair
What is the average price for a property for sale in Llanbrynmair?
The average price for a property for sale in Llanbrynmair is £314,820. This amount is 3% higher than the average price in Llanbrynmair. There are 165 property listings for sale in Llanbrynmair.
What streets have the most expensive properties for sale in Llanbrynmair?
The streets with the most expensive properties for sale in Llanbrynmair are Dolfach at an average of £257,500 and Penddol at an average of £227,400.
What streets have the most affordable properties for sale in Llanbrynmair?
The street with the most affordable properties for sale in Llanbrynmair is Rock Terrace at an average of £225,000.
Which train stations are available in or near Llanbrynmair?
Some of the train stations available in or near Llanbrynmair are Machynlleth, Caersws and Dovey Junction.
Property Price Paid in Llanbrynmair by Year
The average sold property price by year was:
| Year | Average Sold Price | Price Change |
Sold Properties
|
|---|---|---|---|
| 2023 | £354,928 | 7% |
7 Properties |
| 2022 | £331,568 | 16% |
13 Properties |
| 2021 | £279,214 | 27% |
14 Properties |
| 2020 | £204,227 | 7% |
11 Properties |
| 2019 | £190,172 | -2% |
11 Properties |
| 2018 | £194,651 | -1% |
18 Properties |
| 2017 | £196,325 | -6% |
20 Properties |
| 2016 | £209,000 | 15% |
5 Properties |
| 2015 | £176,633 | -10% |
15 Properties |
| 2014 | £195,031 | 18% |
16 Properties |
| 2013 | £160,350 | -49% |
10 Properties |
| 2012 | £239,099 | 12% |
5 Properties |
| 2011 | £209,775 | -2% |
4 Properties |
| 2010 | £214,500 | 29% |
4 Properties |
| 2009 | £152,500 | -19% |
9 Properties |
| 2008 | £180,777 | -4% |
9 Properties |
| 2007 | £188,815 | 11% |
10 Properties |
| 2006 | £168,903 | 32% |
16 Properties |
| 2005 | £115,500 | -25% |
6 Properties |
| 2004 | £144,576 | 22% |
13 Properties |
| 2003 | £112,623 | 20% |
18 Properties |
| 2002 | £90,361 | 17% |
22 Properties |
| 2001 | £75,250 | 7% |
12 Properties |
| 2000 | £69,791 | 16% |
12 Properties |
| 1999 | £58,571 | -12% |
14 Properties |
| 1998 | £65,369 | -3% |
9 Properties |
| 1997 | £67,038 | 19% |
15 Properties |
| 1996 | £54,000 | 26% |
8 Properties |
| 1995 | £40,214 | - |
7 Properties |
Property Price per Property Type in Llanbrynmair
Here you can find historic sold price data in order to help with your property search.
The average Property Paid Price for specific property types in the last three years are:
| Property Type | Average Sold Price | Sold Properties |
|---|---|---|
| Semi Detached House | £240,000.00 | 5 Semi Detached Houses |
| Terraced House | £168,333.00 | 3 Terraced Houses |
| Detached House | £346,111.00 | 26 Detached Houses |