
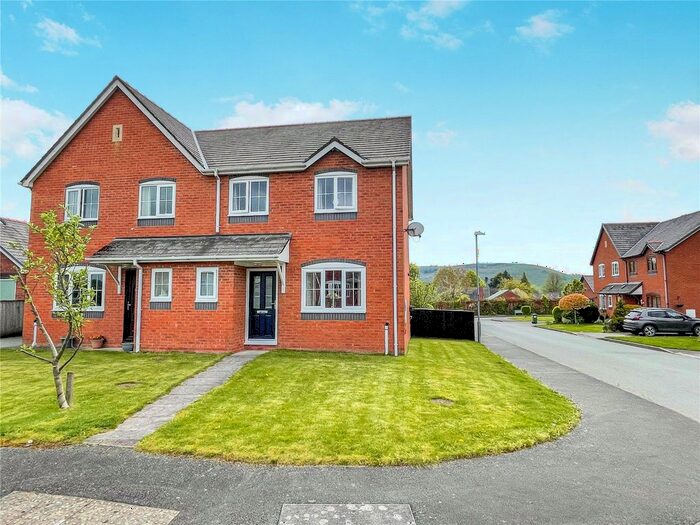
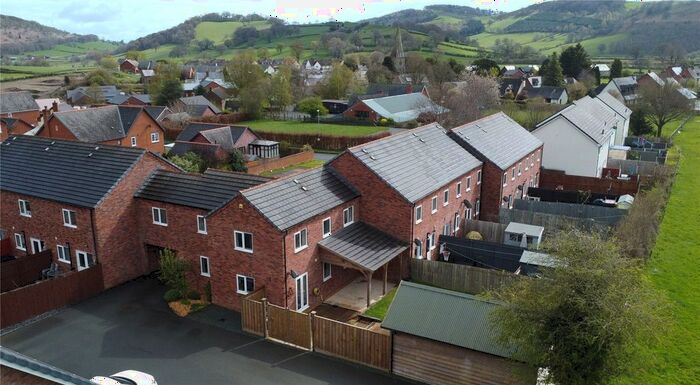
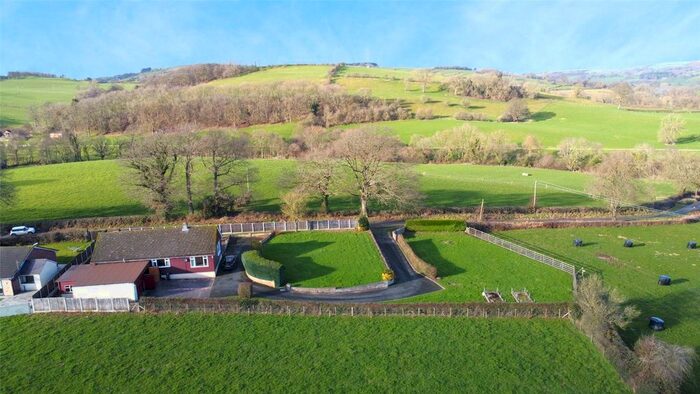
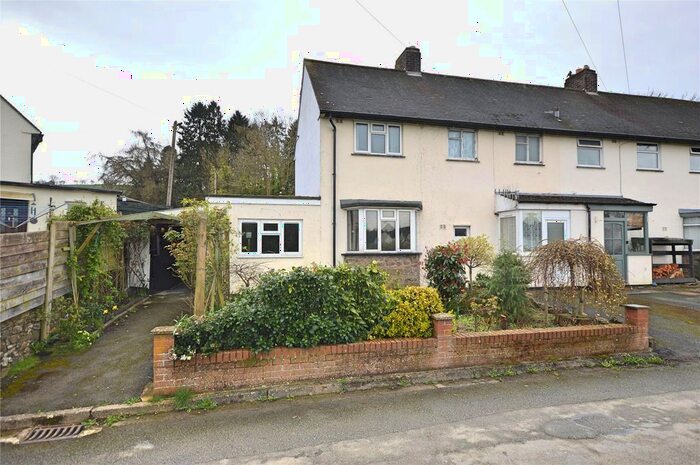
Houses for sale & to rent in Berriew, Welshpool
House Prices in Berriew
Properties in Berriew have an average house price of £348,105.00 and had 34 Property Transactions within the last 3 years¹.
Berriew is an area in Welshpool, Powys - Powys with 470 households², where the most expensive property was sold for £640,000.00.
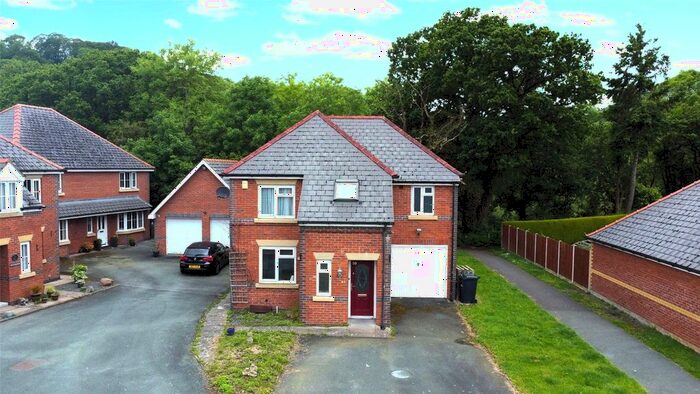
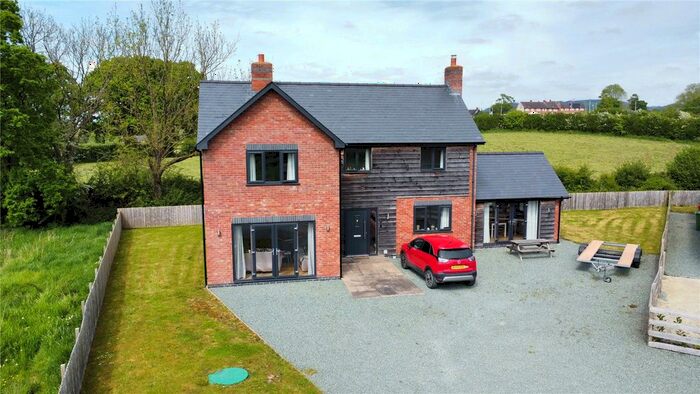
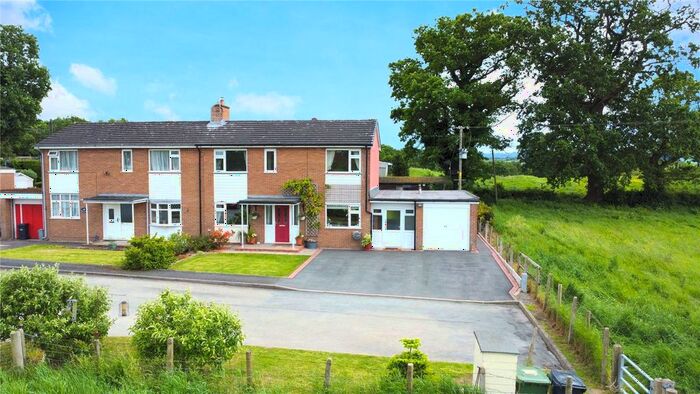
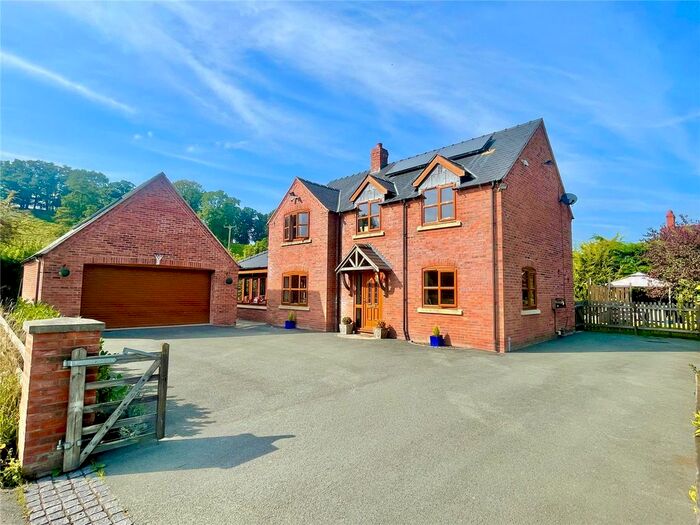
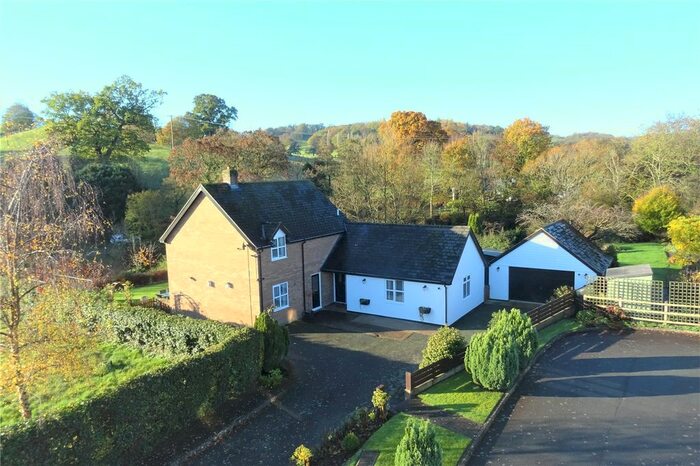
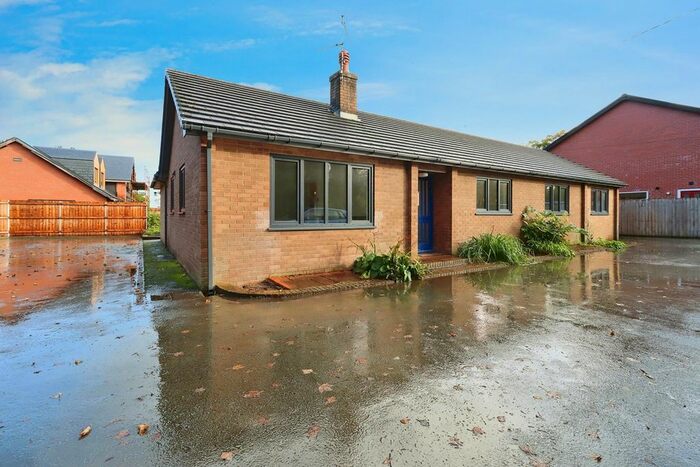
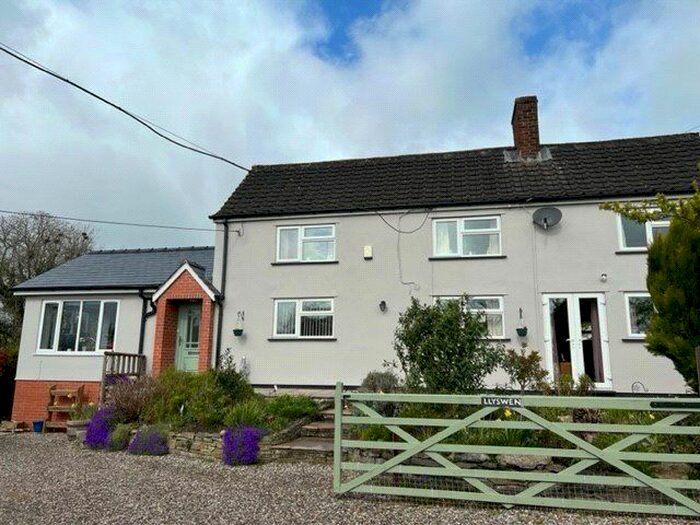
Properties for sale in Berriew


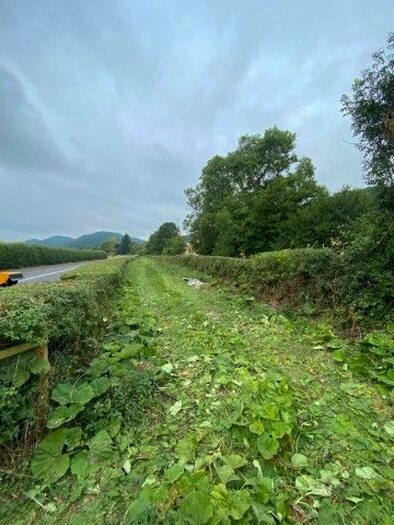
Previously listed properties in Berriew


Roads and Postcodes in Berriew
Navigate through our locations to find the location of your next house in Berriew, Welshpool for sale or to rent.
| Streets | Postcodes |
|---|---|
| Brooks | SY21 8QN SY21 8QR SY21 8QS |
| Cae Celyn | SY21 8BT |
| Cefn-y-faenor | SY21 8PP |
| Chapel Fields | SY21 8BU |
| Church Terrace | SY21 8PF |
| Cil Common | SY21 8AX |
| Cross Lane | SY21 8AF |
| Glan Yr Afon | SY21 8PN |
| Gro Cottages | SY21 8AL |
| Maesbeuno | SY21 8PE |
| Manafon Road | SY21 8BB |
| Pentre Llifior | SY21 8QJ |
| Rectory View | SY21 8FB |
| Refail Parc | SY21 8BF |
| Revel | SY21 8AH SY21 8AJ SY21 8QA SY21 8QB |
| St Beunos Cottages | SY21 8AG |
| The Sign | SY21 8PH |
| SY21 8AA SY21 8AB SY21 8AD SY21 8AN SY21 8AP SY21 8AQ SY21 8AS SY21 8AT SY21 8AU SY21 8AY SY21 8AZ SY21 8BA SY21 8BD SY21 8BE SY21 8BG SY21 8BH SY21 8BQ SY21 8PD SY21 8PG SY21 8PJ SY21 8PL SY21 8PQ SY21 8QG SY21 8QQ SY21 8QX SY21 8AE SY21 8AW SY21 8PR SY21 8PS SY21 8PW SY21 8QE SY21 8QF SY21 8QH SY21 8QT SY21 8QY SY21 8SH SY21 9AU |
Transport near Berriew

- FAQ
- Price Paid By Year
- Property Type Price
Frequently asked questions about Berriew
What is the average price for a property for sale in Berriew?
The average price for a property for sale in Berriew is £348,105. This amount is 29% higher than the average price in Welshpool. There are 117 property listings for sale in Berriew.
What streets have the most expensive properties for sale in Berriew?
The streets with the most expensive properties for sale in Berriew are Refail Parc at an average of £550,000, Manafon Road at an average of £500,000 and Brooks at an average of £327,500.
What streets have the most affordable properties for sale in Berriew?
The streets with the most affordable properties for sale in Berriew are Gro Cottages at an average of £150,000, Glan Yr Afon at an average of £210,333 and Rectory View at an average of £253,500.
Which train stations are available in or near Berriew?
Some of the train stations available in or near Berriew are Welshpool, Newtown and Caersws.
Property Price Paid in Berriew by Year
The average sold property price by year was:
| Year | Average Sold Price | Price Change |
Sold Properties
|
|---|---|---|---|
| 2024 | £200,000 | -92% |
1 Property |
| 2023 | £384,948 | -3% |
8 Properties |
| 2022 | £394,666 | 26% |
12 Properties |
| 2021 | £293,846 | 22% |
13 Properties |
| 2020 | £229,388 | -3% |
9 Properties |
| 2019 | £235,426 | -7% |
17 Properties |
| 2018 | £251,268 | 13% |
11 Properties |
| 2017 | £218,863 | 9% |
11 Properties |
| 2016 | £199,904 | 15% |
11 Properties |
| 2015 | £170,318 | -15% |
11 Properties |
| 2014 | £195,066 | -10% |
15 Properties |
| 2013 | £214,181 | -8% |
11 Properties |
| 2012 | £231,618 | -28% |
8 Properties |
| 2011 | £295,583 | 30% |
6 Properties |
| 2010 | £207,800 | -3% |
5 Properties |
| 2009 | £213,730 | -37% |
13 Properties |
| 2008 | £293,086 | 14% |
11 Properties |
| 2007 | £252,882 | -8% |
17 Properties |
| 2006 | £273,833 | 29% |
12 Properties |
| 2005 | £193,359 | -0,1% |
11 Properties |
| 2004 | £193,500 | 15% |
9 Properties |
| 2003 | £165,207 | 20% |
7 Properties |
| 2002 | £132,826 | 14% |
5 Properties |
| 2001 | £114,750 | 13% |
8 Properties |
| 2000 | £99,472 | 11% |
9 Properties |
| 1999 | £88,166 | 9% |
9 Properties |
| 1998 | £80,162 | 21% |
12 Properties |
| 1997 | £63,275 | -7% |
10 Properties |
| 1996 | £67,625 | 31% |
8 Properties |
| 1995 | £46,493 | - |
8 Properties |
Property Price per Property Type in Berriew
Here you can find historic sold price data in order to help with your property search.
The average Property Paid Price for specific property types in the last three years are:
| Property Type | Average Sold Price | Sold Properties |
|---|---|---|
| Semi Detached House | £236,559.00 | 10 Semi Detached Houses |
| Detached House | £404,304.00 | 23 Detached Houses |
| Terraced House | £171,000.00 | 1 Terraced House |