
Houses for sale & to rent in Llanfair Caereinion, Welshpool
House Prices in Llanfair Caereinion
Properties in Llanfair Caereinion have an average house price of £283,448.00 and had 57 Property Transactions within the last 3 years¹.
Llanfair Caereinion is an area in Welshpool, Powys - Powys with 727 households², where the most expensive property was sold for £1,060,000.00.
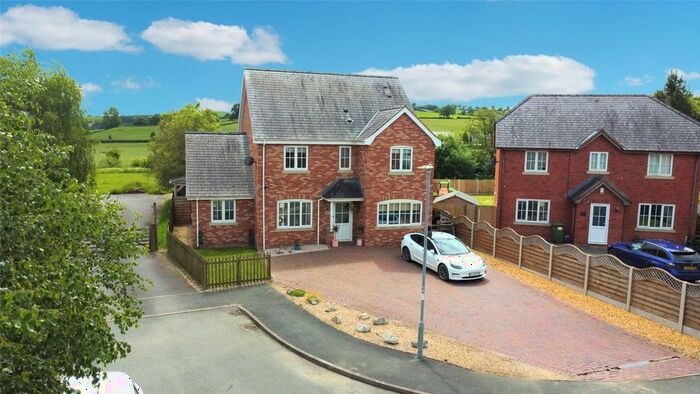
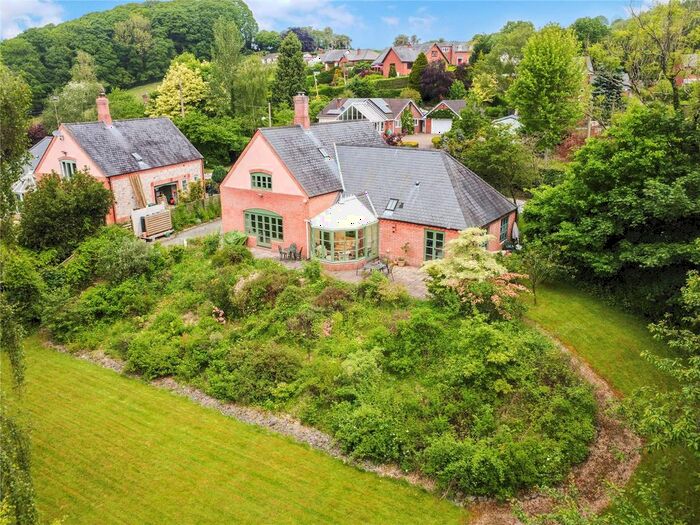
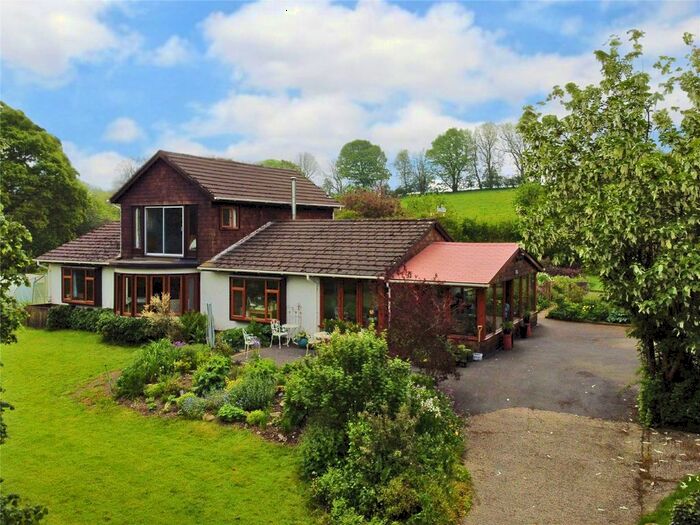
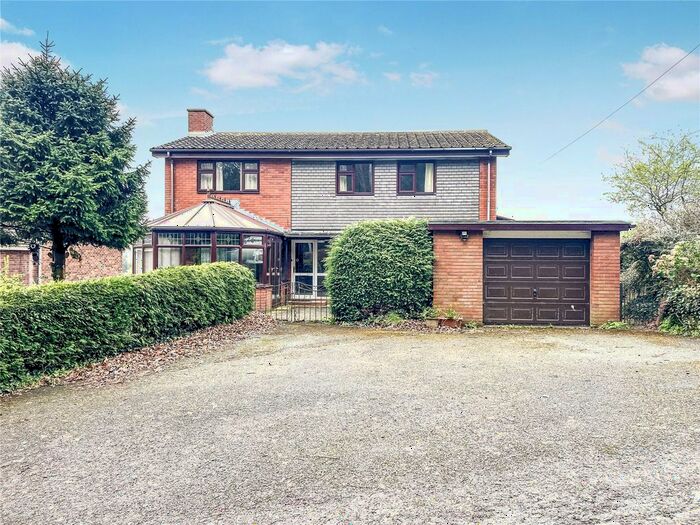
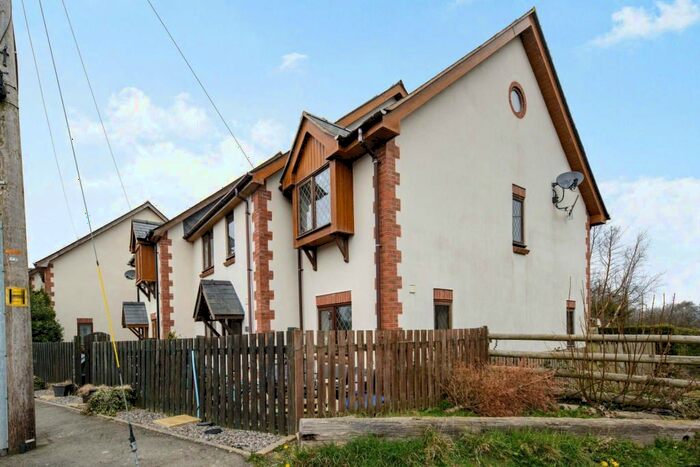
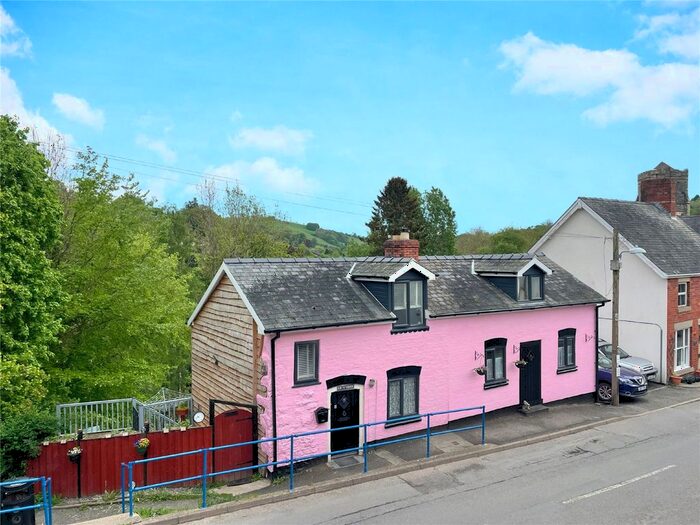
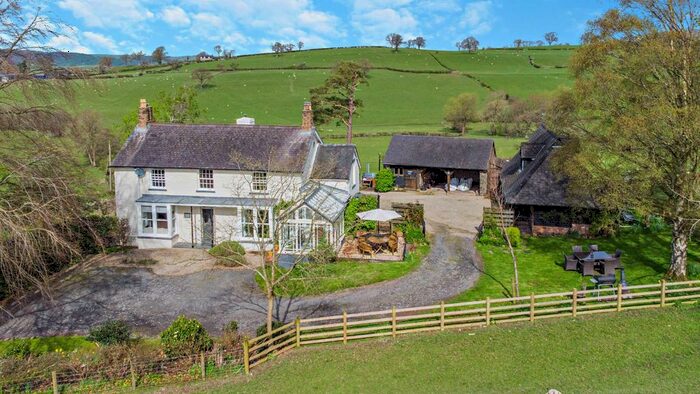
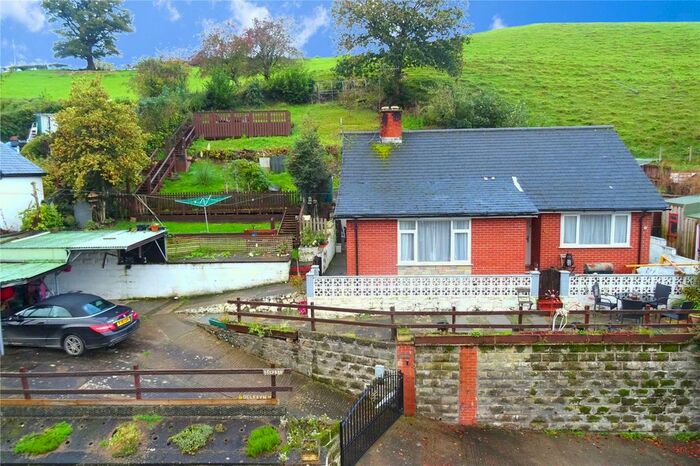
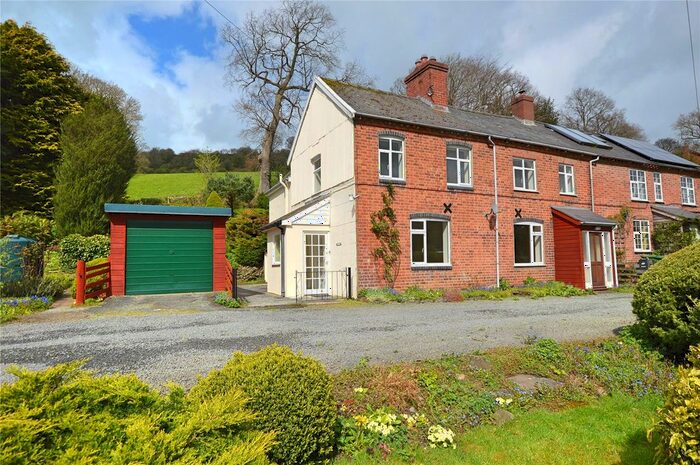
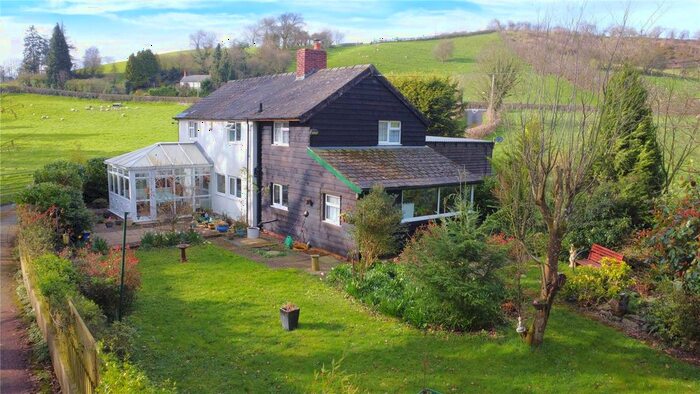
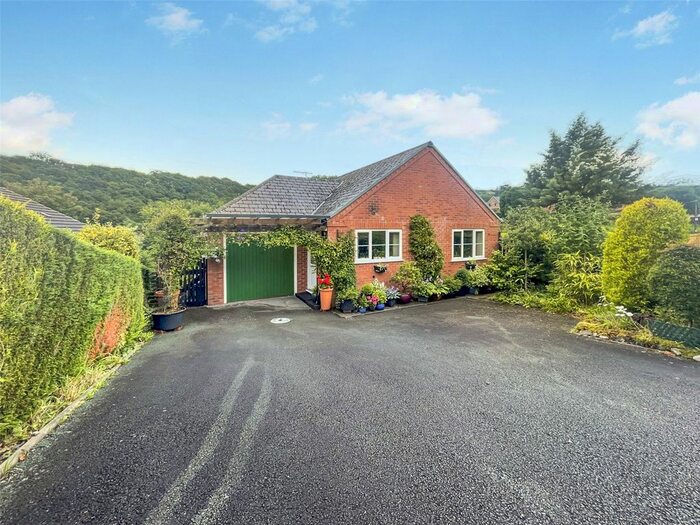
Properties for sale in Llanfair Caereinion

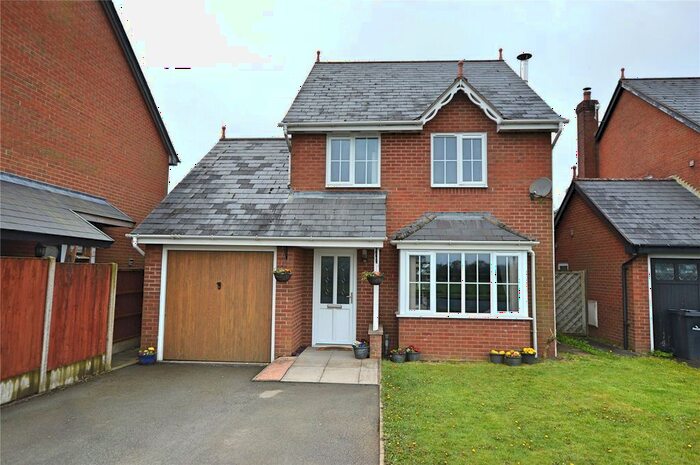


Previously listed properties in Llanfair Caereinion


Roads and Postcodes in Llanfair Caereinion
Navigate through our locations to find the location of your next house in Llanfair Caereinion, Welshpool for sale or to rent.
Transport near Llanfair Caereinion

- FAQ
- Price Paid By Year
- Property Type Price
Frequently asked questions about Llanfair Caereinion
What is the average price for a property for sale in Llanfair Caereinion?
The average price for a property for sale in Llanfair Caereinion is £283,448. This amount is 9% higher than the average price in Welshpool. There are 176 property listings for sale in Llanfair Caereinion.
What streets have the most expensive properties for sale in Llanfair Caereinion?
The streets with the most expensive properties for sale in Llanfair Caereinion are Wesley Street at an average of £350,000, Hassel Square at an average of £286,000 and New Road at an average of £271,666.
What streets have the most affordable properties for sale in Llanfair Caereinion?
The streets with the most affordable properties for sale in Llanfair Caereinion are Pool Road at an average of £92,250, Broad Street at an average of £140,000 and Bridge Street at an average of £148,278.
Which train stations are available in or near Llanfair Caereinion?
Some of the train stations available in or near Llanfair Caereinion are Welshpool, Newtown and Caersws.
Property Price Paid in Llanfair Caereinion by Year
The average sold property price by year was:
| Year | Average Sold Price | Price Change |
Sold Properties
|
|---|---|---|---|
| 2024 | £315,000 | 27% |
2 Properties |
| 2023 | £230,410 | -55% |
15 Properties |
| 2022 | £357,630 | 25% |
15 Properties |
| 2021 | £268,238 | 7% |
25 Properties |
| 2020 | £249,533 | 29% |
15 Properties |
| 2019 | £178,187 | -5% |
16 Properties |
| 2018 | £187,603 | -6% |
31 Properties |
| 2017 | £198,675 | 11% |
20 Properties |
| 2016 | £177,729 | 15% |
17 Properties |
| 2015 | £150,642 | -27% |
21 Properties |
| 2014 | £191,153 | 23% |
13 Properties |
| 2013 | £146,625 | -12% |
12 Properties |
| 2012 | £164,187 | -9% |
12 Properties |
| 2011 | £179,200 | 3% |
6 Properties |
| 2010 | £174,692 | -6% |
13 Properties |
| 2009 | £184,468 | 10% |
16 Properties |
| 2008 | £165,284 | -31% |
13 Properties |
| 2007 | £216,605 | 27% |
26 Properties |
| 2006 | £157,980 | 5% |
26 Properties |
| 2005 | £150,354 | -3% |
24 Properties |
| 2004 | £154,913 | 22% |
29 Properties |
| 2003 | £120,124 | -3% |
19 Properties |
| 2002 | £123,764 | 25% |
17 Properties |
| 2001 | £92,818 | 19% |
19 Properties |
| 2000 | £75,228 | 24% |
28 Properties |
| 1999 | £56,900 | -22% |
20 Properties |
| 1998 | £69,500 | 5% |
13 Properties |
| 1997 | £66,023 | 25% |
19 Properties |
| 1996 | £49,247 | 5% |
23 Properties |
| 1995 | £46,726 | - |
15 Properties |
Property Price per Property Type in Llanfair Caereinion
Here you can find historic sold price data in order to help with your property search.
The average Property Paid Price for specific property types in the last three years are:
| Property Type | Average Sold Price | Sold Properties |
|---|---|---|
| Semi Detached House | £161,677.00 | 11 Semi Detached Houses |
| Detached House | £355,117.00 | 37 Detached Houses |
| Terraced House | £137,638.00 | 9 Terraced Houses |