
Houses for sale & to rent in Lledrod, Ystrad Meurig
House Prices in Lledrod
Properties in Lledrod have an average house price of £241,512.00 and had 55 Property Transactions within the last 3 years¹.
Lledrod is an area in Ystrad Meurig, Sir Ceredigion - Ceredigion with 615 households², where the most expensive property was sold for £960,000.00.
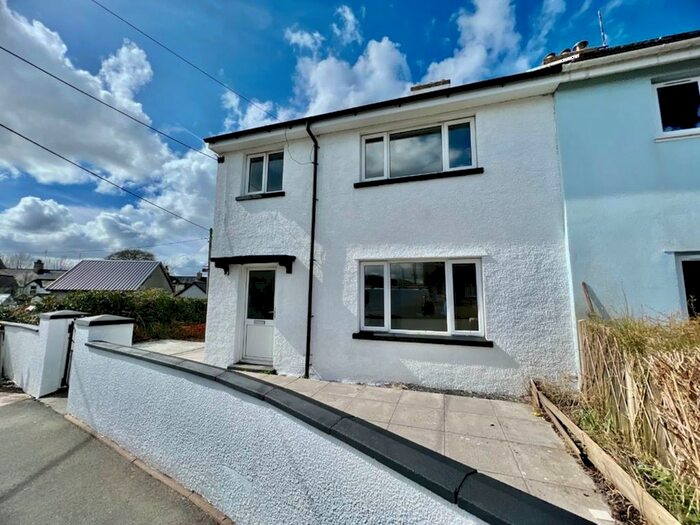
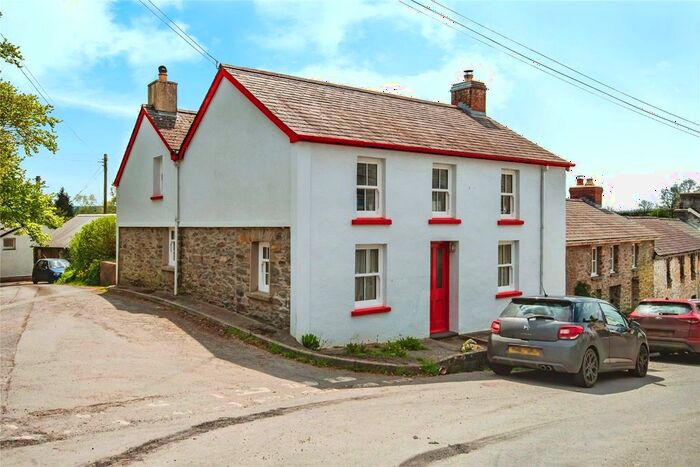
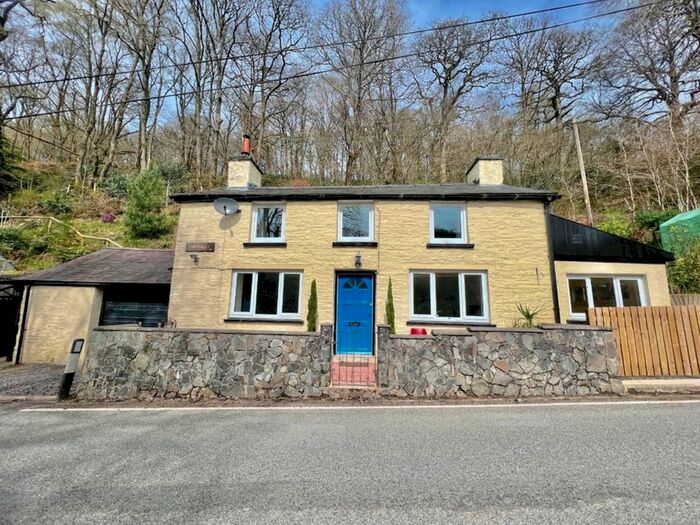
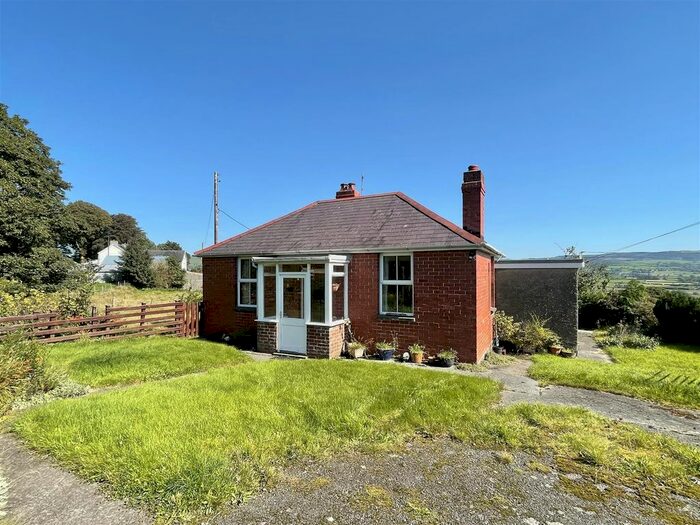
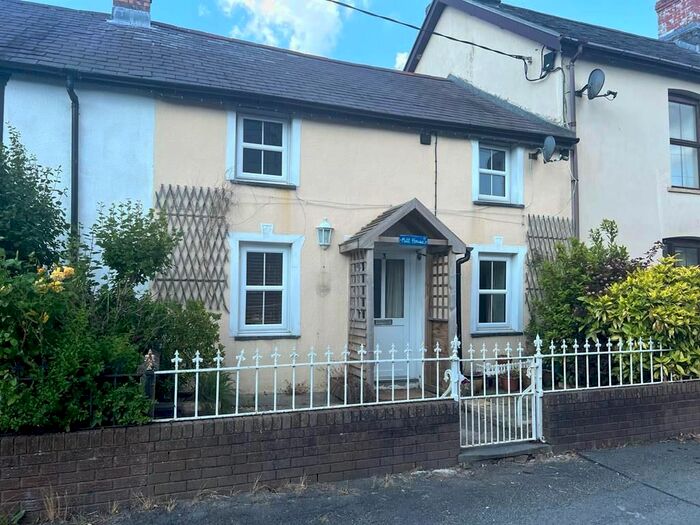
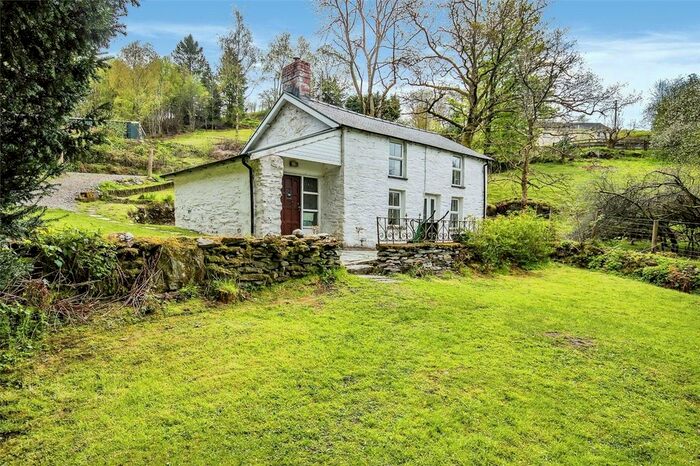
Properties for sale in Lledrod


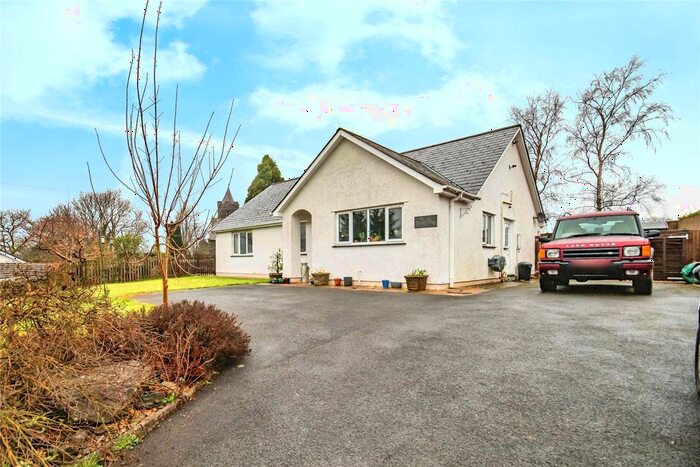
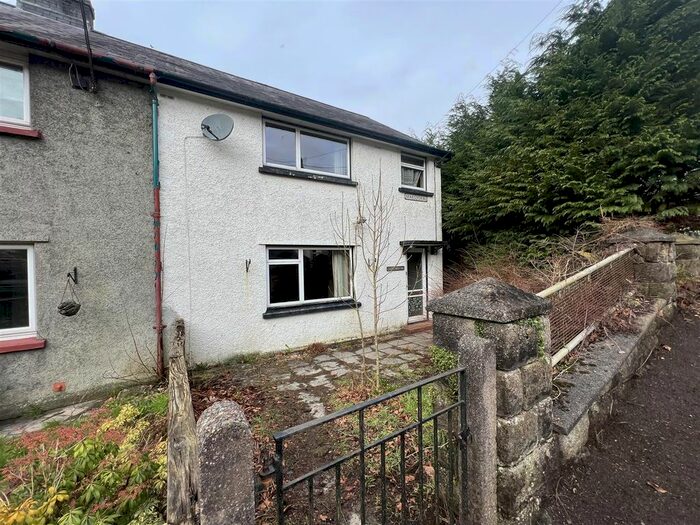
Previously listed properties in Lledrod


Roads and Postcodes in Lledrod
Navigate through our locations to find the location of your next house in Lledrod, Ystrad Meurig for sale or to rent.
| Streets | Postcodes |
|---|---|
| Bridge Street | SY25 6EE |
| Cwrt Y Wern | SY25 6EB |
| Heol Maesglas | SY25 6DY |
| Heol Y Bannau | SY25 6AZ |
| Lisburne Row | SY25 6EQ |
| Maesydderwen | SY25 6EU |
| Maesyderi | SY25 6DL |
| Mill Street | SY25 6BG |
| Mount Pleasant | SY25 6DH |
| New Row | SY25 6DT |
| Oak Street | SY25 6EW |
| Poplar Terrace | SY25 6BQ |
| Rose Cottages | SY25 6BW |
| Teifi Street | SY25 6EH |
| Terrace Road | SY25 6EG |
| SY25 6AA SY25 6AB SY25 6AD SY25 6AE SY25 6AG SY25 6AH SY25 6AL SY25 6AN SY25 6AP SY25 6AW SY25 6AX SY25 6AY SY25 6BB SY25 6BD SY25 6BE SY25 6BH SY25 6BL SY25 6BN SY25 6BP SY25 6BS SY25 6DA SY25 6DB SY25 6DD SY25 6DE SY25 6DF SY25 6DG SY25 6DN SY25 6DP SY25 6DQ SY25 6DR SY25 6DS SY25 6DW SY25 6ED SY25 6EF SY25 6EJ SY25 6EL SY25 6EP SY25 6ER SY25 6ET |
Transport near Lledrod
-
 Aberystwyth Station
 -
Borth Station
-
Llanwrtyd Station
-
Sugar Loaf Station
-
Cynghordy Station
-
Penhelig Station
-
Garth (Powys) Station
-
Dovey Junction Station
-
Llangammarch Station
-
Aberdovey Station
- FAQ
- Price Paid By Year
- Property Type Price
Frequently asked questions about Lledrod
What is the average price for a property for sale in Lledrod?
The average price for a property for sale in Lledrod is £241,512. There are 79 property listings for sale in Lledrod.
What streets have the most expensive properties for sale in Lledrod?
The streets with the most expensive properties for sale in Lledrod are Rose Cottages at an average of £229,950, Bridge Street at an average of £180,000 and Lisburne Row at an average of £160,000.
What streets have the most affordable properties for sale in Lledrod?
The streets with the most affordable properties for sale in Lledrod are New Row at an average of £126,333, Terrace Road at an average of £130,000 and Maesydderwen at an average of £147,666.
Which train stations are available in or near Lledrod?
Some of the train stations available in or near Lledrod are Aberystwyth, Borth and Llanwrtyd.
Property Price Paid in Lledrod by Year
The average sold property price by year was:
| Year | Average Sold Price | Price Change |
Sold Properties
|
|---|---|---|---|
| 2024 | £317,500 | 32% |
2 Properties |
| 2023 | £217,366 | -29% |
15 Properties |
| 2022 | £279,861 | 28% |
22 Properties |
| 2021 | £201,921 | 19% |
16 Properties |
| 2020 | £162,784 | -16% |
17 Properties |
| 2019 | £188,746 | -3% |
16 Properties |
| 2018 | £193,705 | 36% |
17 Properties |
| 2017 | £124,621 | -35% |
16 Properties |
| 2016 | £168,555 | -6% |
18 Properties |
| 2015 | £178,785 | 20% |
21 Properties |
| 2014 | £142,643 | 5% |
24 Properties |
| 2013 | £134,994 | -21% |
10 Properties |
| 2012 | £162,800 | -10% |
10 Properties |
| 2011 | £178,590 | 26% |
11 Properties |
| 2010 | £131,835 | -58% |
10 Properties |
| 2009 | £208,499 | 14% |
13 Properties |
| 2008 | £180,162 | 9% |
12 Properties |
| 2007 | £164,688 | -7% |
21 Properties |
| 2006 | £175,868 | 33% |
19 Properties |
| 2005 | £117,928 | -16% |
21 Properties |
| 2004 | £137,161 | 28% |
29 Properties |
| 2003 | £98,292 | 27% |
22 Properties |
| 2002 | £71,901 | 16% |
31 Properties |
| 2001 | £60,651 | 28% |
30 Properties |
| 2000 | £43,371 | -21% |
22 Properties |
| 1999 | £52,278 | 8% |
22 Properties |
| 1998 | £47,863 | -27% |
11 Properties |
| 1997 | £60,559 | 23% |
15 Properties |
| 1996 | £46,863 | 32% |
15 Properties |
| 1995 | £31,800 | - |
5 Properties |
Property Price per Property Type in Lledrod
Here you can find historic sold price data in order to help with your property search.
The average Property Paid Price for specific property types in the last three years are:
| Property Type | Average Sold Price | Sold Properties |
|---|---|---|
| Semi Detached House | £180,200.00 | 11 Semi Detached Houses |
| Detached House | £298,725.00 | 31 Detached Houses |
| Terraced House | £156,961.00 | 13 Terraced Houses |