
Houses for sale & to rent in Llanarmon-yn-ial/llandegla, Wrexham
House Prices in Llanarmon-yn-ial/llandegla
Properties in Llanarmon-yn-ial/llandegla have an average house price of £355,352.00 and had 15 Property Transactions within the last 3 years¹.
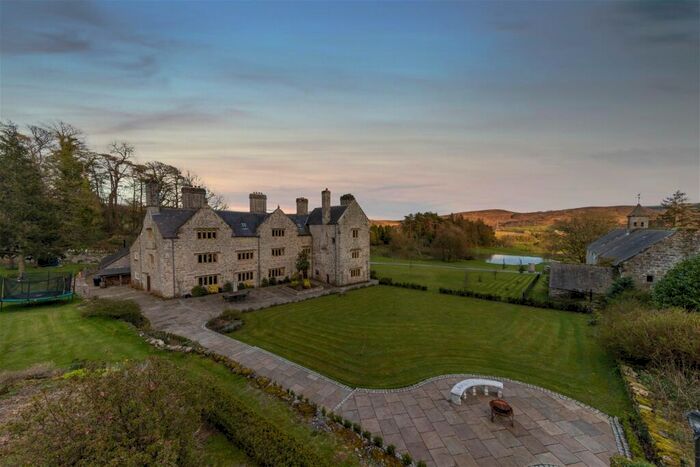
Llanarmon-yn-ial/llandegla is an area in Wrexham, Sir Ddinbych - Denbighshire with 216 households², where the most expensive property was sold for £785,000.00.
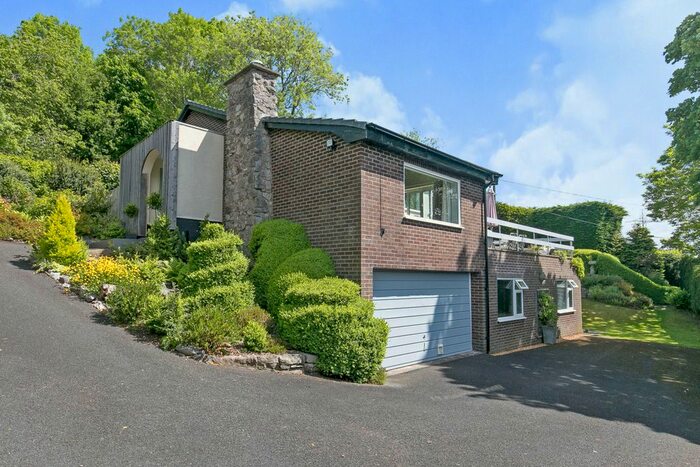
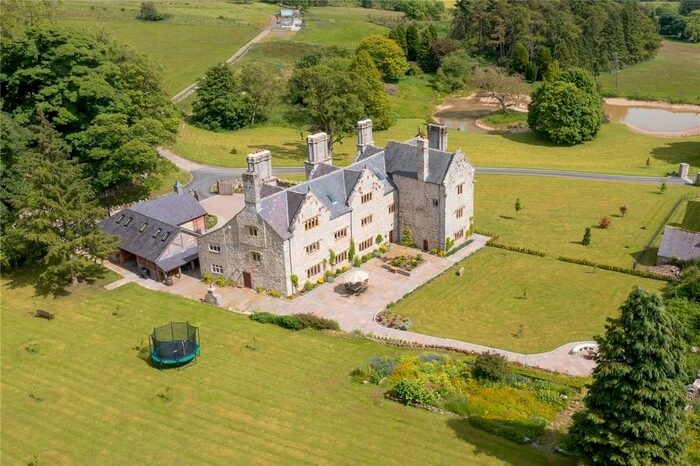
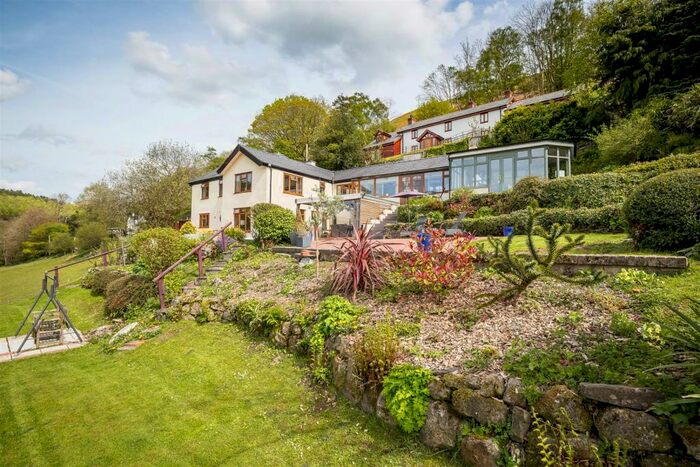
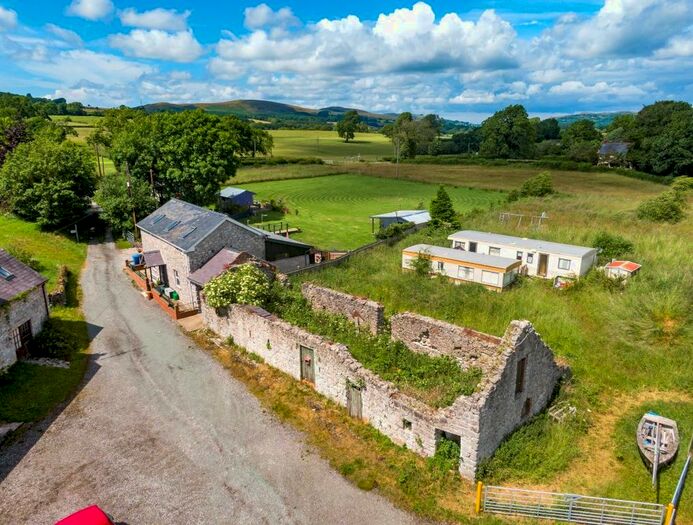
Properties for sale in Llanarmon-yn-ial/llandegla


Previously listed properties in Llanarmon-yn-ial/llandegla


Roads and Postcodes in Llanarmon-yn-ial/llandegla
Navigate through our locations to find the location of your next house in Llanarmon-yn-ial/llandegla, Wrexham for sale or to rent.
| Streets | Postcodes |
|---|---|
| Bryn Tegla | LL11 3AX |
| Church Terrace | LL11 3AS |
| Ffynnon Tegla | LL11 3BJ |
| Maesteg | LL11 3AP |
| Pen Llan | LL11 3AZ |
| Plas Teg | LL11 3AQ |
| Tainewyddion | LL11 3BH |
| Trem Y Grug | LL11 3EJ |
| LL11 3AA LL11 3AB LL11 3AE LL11 3AG LL11 3AH LL11 3AL LL11 3AN LL11 3AR LL11 3AT LL11 3AU LL11 3AW LL11 3AY LL11 3BB LL11 3BG LL11 3AD LL11 3AF LL11 3BA LL11 3BE |
Transport near Llanarmon-yn-ial/llandegla
-
 Cefn-Y-Bedd Station
 -
Gwersyllt Station
-
Caergwrle Station
-
Hope (Clwyd) Station
-
Ruabon Station
-
Wrexham General Station
-
Wrexham Central Station
-
Penyffordd Station
-
Buckley Station
- FAQ
- Price Paid By Year
- Property Type Price
Frequently asked questions about Llanarmon-yn-ial/llandegla
What is the average price for a property for sale in Llanarmon-yn-ial/llandegla?
The average price for a property for sale in Llanarmon-yn-ial/llandegla is £355,352. There are 36 property listings for sale in Llanarmon-yn-ial/llandegla.
What streets have the most expensive properties for sale in Llanarmon-yn-ial/llandegla?
The street with the most expensive properties for sale in Llanarmon-yn-ial/llandegla is Trem Y Grug at an average of £233,333.
What streets have the most affordable properties for sale in Llanarmon-yn-ial/llandegla?
The street with the most affordable properties for sale in Llanarmon-yn-ial/llandegla is Tainewyddion at an average of £90,000.
Which train stations are available in or near Llanarmon-yn-ial/llandegla?
Some of the train stations available in or near Llanarmon-yn-ial/llandegla are Cefn-Y-Bedd, Gwersyllt and Caergwrle.
Property Price Paid in Llanarmon-yn-ial/llandegla by Year
The average sold property price by year was:
| Year | Average Sold Price | Price Change |
Sold Properties
|
|---|---|---|---|
| 2023 | £379,000 | -13% |
5 Properties |
| 2022 | £429,068 | 40% |
5 Properties |
| 2021 | £257,990 | -0,4% |
5 Properties |
| 2020 | £259,000 | -10% |
3 Properties |
| 2019 | £285,166 | 22% |
6 Properties |
| 2018 | £221,916 | 28% |
6 Properties |
| 2017 | £158,916 | -21% |
3 Properties |
| 2016 | £191,990 | -28% |
5 Properties |
| 2015 | £246,600 | 33% |
5 Properties |
| 2014 | £164,900 | -12% |
9 Properties |
| 2013 | £185,000 | 6% |
1 Property |
| 2012 | £174,709 | -9% |
14 Properties |
| 2011 | £191,025 | -10% |
12 Properties |
| 2010 | £209,300 | -19% |
5 Properties |
| 2009 | £250,000 | 42% |
1 Property |
| 2008 | £144,650 | -60% |
6 Properties |
| 2007 | £231,145 | -11% |
10 Properties |
| 2006 | £256,100 | 58% |
5 Properties |
| 2005 | £107,487 | -53% |
4 Properties |
| 2004 | £164,428 | 22% |
7 Properties |
| 2003 | £128,000 | -4% |
6 Properties |
| 2002 | £133,066 | 65% |
6 Properties |
| 2001 | £46,806 | -95% |
8 Properties |
| 2000 | £91,487 | -19% |
4 Properties |
| 1999 | £108,535 | 39% |
7 Properties |
| 1998 | £66,166 | -29% |
6 Properties |
| 1997 | £85,475 | 35% |
2 Properties |
| 1996 | £55,634 | 25% |
6 Properties |
| 1995 | £42,000 | - |
3 Properties |
Property Price per Property Type in Llanarmon-yn-ial/llandegla
Here you can find historic sold price data in order to help with your property search.
The average Property Paid Price for specific property types in the last three years are:
| Property Type | Average Sold Price | Sold Properties |
|---|---|---|
| Terraced House | £148,446.00 | 3 Terraced Houses |
| Detached House | £424,086.00 | 11 Detached Houses |
| Semi Detached House | £220,000.00 | 1 Semi Detached House |