
Houses for sale & to rent in Llangybi Fawr, Newport
House Prices in Llangybi Fawr
Properties in Llangybi Fawr have an average house price of £600,727.00 and had 11 Property Transactions within the last 3 years¹.
Llangybi Fawr is an area in Newport, Sir Fynwy - Monmouthshire with 177 households², where the most expensive property was sold for £1,350,000.00.
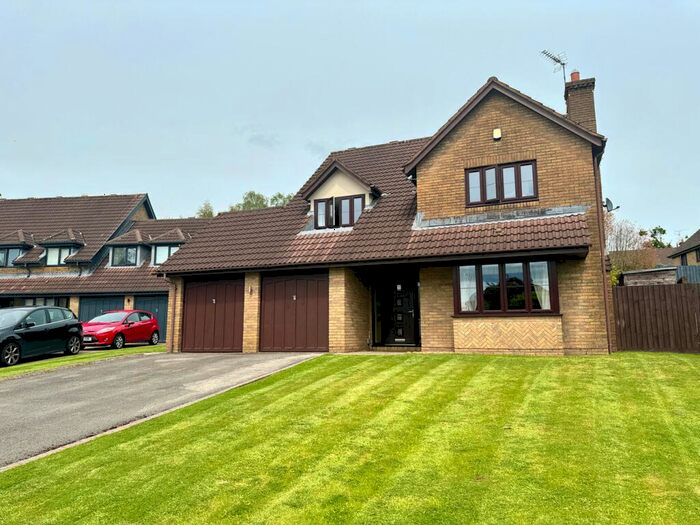
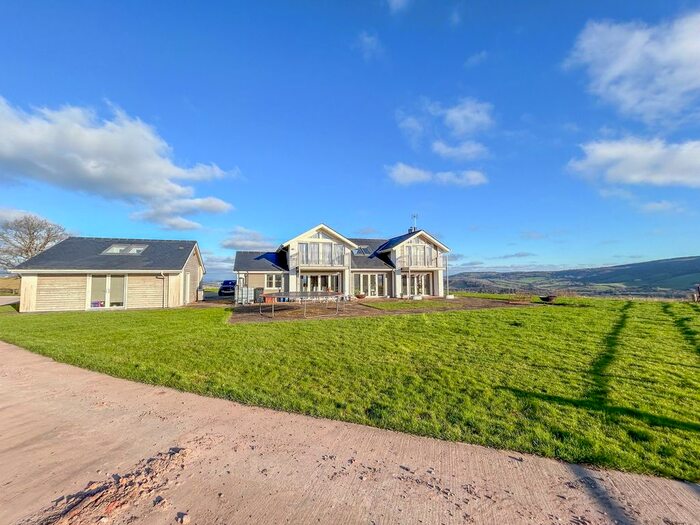
Properties for sale in Llangybi Fawr


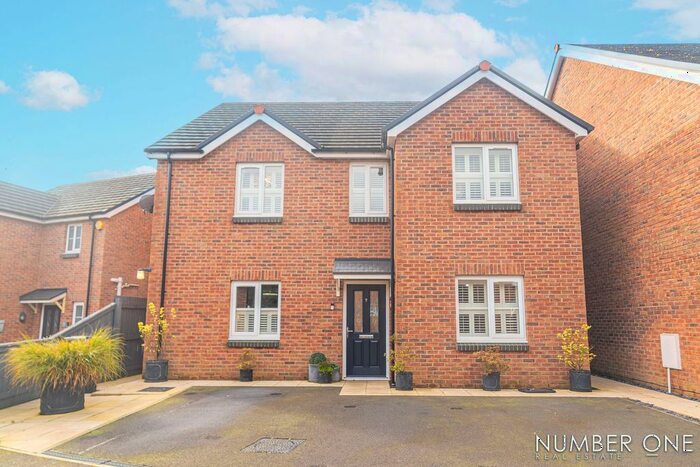


Previously listed properties in Llangybi Fawr


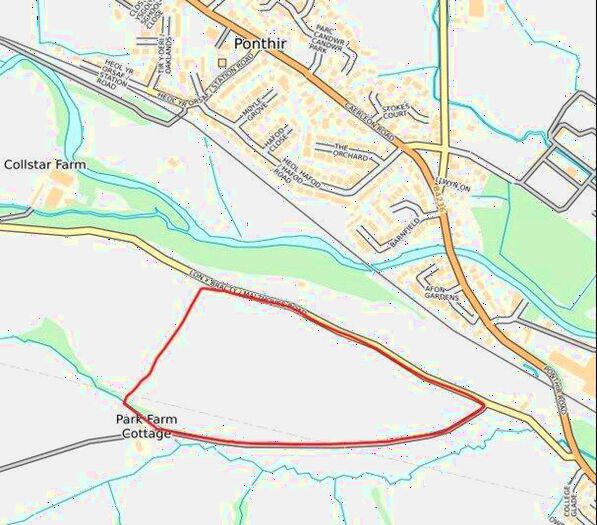
Roads and Postcodes in Llangybi Fawr
Navigate through our locations to find the location of your next house in Llangybi Fawr, Newport for sale or to rent.
| Streets | Postcodes |
|---|---|
| Candwr Road | NP18 1HU |
| Church Road | NP18 1JA |
| Llansoar | NP18 1LR NP18 1LW NP18 1LS |
| Nantsor Road | NP18 1HY |
| Pen Y Glog Road | NP18 1HZ |
| Ty Isaf Road | NP18 1NU |
| NP18 1HS NP18 1HT NP18 1HW NP18 1HX NP18 1LT NP18 1LU NP18 1DD NP18 1HP |
Transport near Llangybi Fawr

- FAQ
- Price Paid By Year
- Property Type Price
Frequently asked questions about Llangybi Fawr
What is the average price for a property for sale in Llangybi Fawr?
The average price for a property for sale in Llangybi Fawr is £600,727. There are 162 property listings for sale in Llangybi Fawr.
What streets have the most expensive properties for sale in Llangybi Fawr?
The street with the most expensive properties for sale in Llangybi Fawr is Pen Y Glog Road at an average of £645,000.
What streets have the most affordable properties for sale in Llangybi Fawr?
The street with the most affordable properties for sale in Llangybi Fawr is Llansoar at an average of £611,250.
Which train stations are available in or near Llangybi Fawr?
Some of the train stations available in or near Llangybi Fawr are Cwmbran, Newport (Gwent) and Pontypool and New Inn.
Property Price Paid in Llangybi Fawr by Year
The average sold property price by year was:
| Year | Average Sold Price | Price Change |
Sold Properties
|
|---|---|---|---|
| 2023 | £796,500 | 60% |
4 Properties |
| 2022 | £318,000 | -75% |
2 Properties |
| 2021 | £557,200 | 0,2% |
5 Properties |
| 2020 | £556,250 | -1% |
4 Properties |
| 2019 | £563,750 | -10% |
4 Properties |
| 2018 | £620,333 | 22% |
3 Properties |
| 2017 | £481,862 | 13% |
4 Properties |
| 2016 | £420,333 | 24% |
6 Properties |
| 2015 | £317,500 | 9% |
4 Properties |
| 2014 | £290,000 | - |
1 Property |
| 2013 | £290,000 | -24% |
2 Properties |
| 2012 | £360,000 | -74% |
4 Properties |
| 2010 | £625,000 | 43% |
1 Property |
| 2009 | £353,483 | -50% |
3 Properties |
| 2008 | £531,250 | -94% |
2 Properties |
| 2007 | £1,030,000 | 60% |
2 Properties |
| 2006 | £407,500 | -23% |
6 Properties |
| 2005 | £501,000 | 38% |
5 Properties |
| 2004 | £311,781 | 38% |
4 Properties |
| 2003 | £192,500 | 8% |
1 Property |
| 2002 | £177,000 | 21% |
5 Properties |
| 2000 | £139,400 | -14% |
5 Properties |
| 1999 | £158,666 | 0,2% |
3 Properties |
| 1998 | £158,300 | 40% |
5 Properties |
| 1997 | £95,000 | -23% |
1 Property |
| 1996 | £116,800 | -0,2% |
5 Properties |
| 1995 | £117,000 | - |
4 Properties |
Property Price per Property Type in Llangybi Fawr
Here you can find historic sold price data in order to help with your property search.
The average Property Paid Price for specific property types in the last three years are:
| Property Type | Average Sold Price | Sold Properties |
|---|---|---|
| Terraced House | £455,500.00 | 2 Terraced Houses |
| Detached House | £695,142.00 | 7 Detached Houses |
| Semi Detached House | £415,500.00 | 2 Semi Detached Houses |