
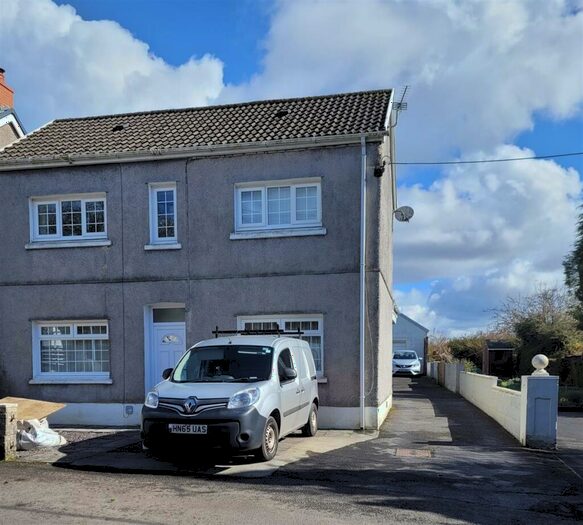
Houses for sale & to rent in Penygroes, Ammanford
House Prices in Penygroes
Properties in Penygroes have an average house price of £225,652.00 and had 24 Property Transactions within the last 3 years¹.
Penygroes is an area in Ammanford, Sir Gaerfyrddin - Carmarthenshire with 175 households², where the most expensive property was sold for £500,000.00.
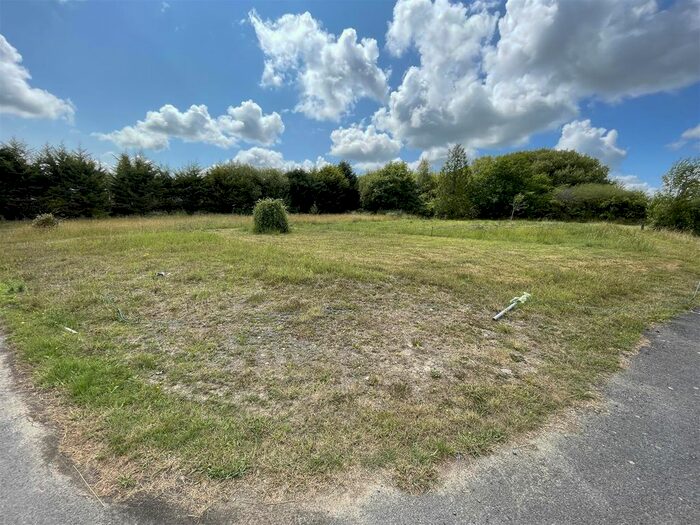
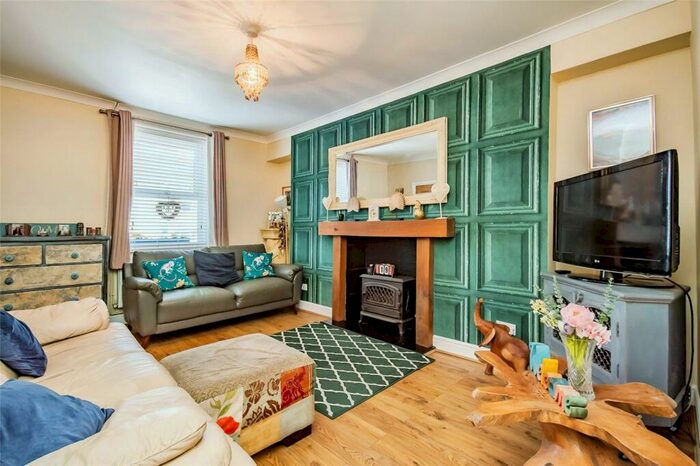
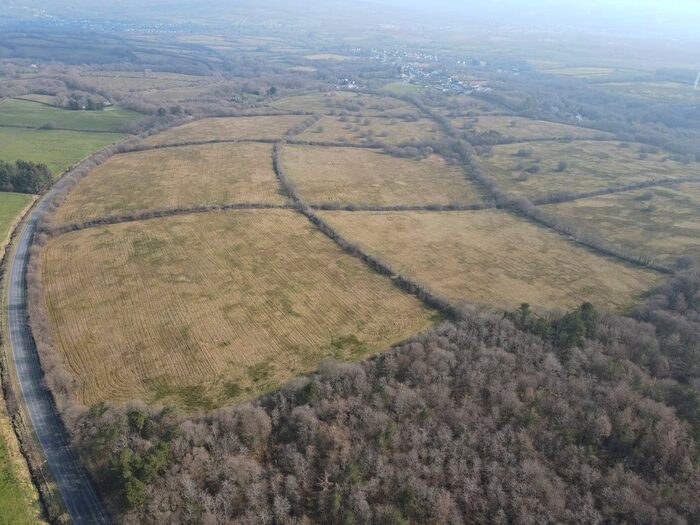
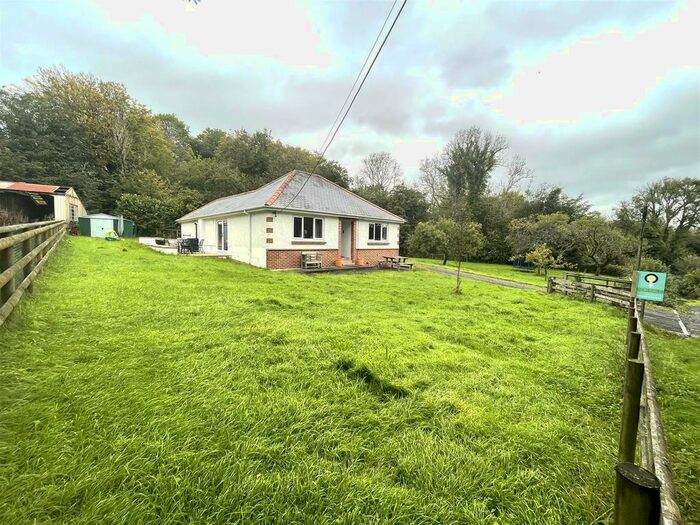
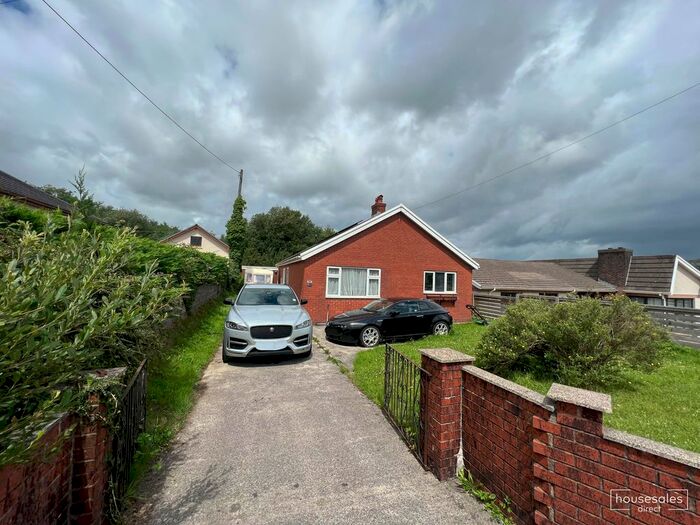
Properties for sale in Penygroes


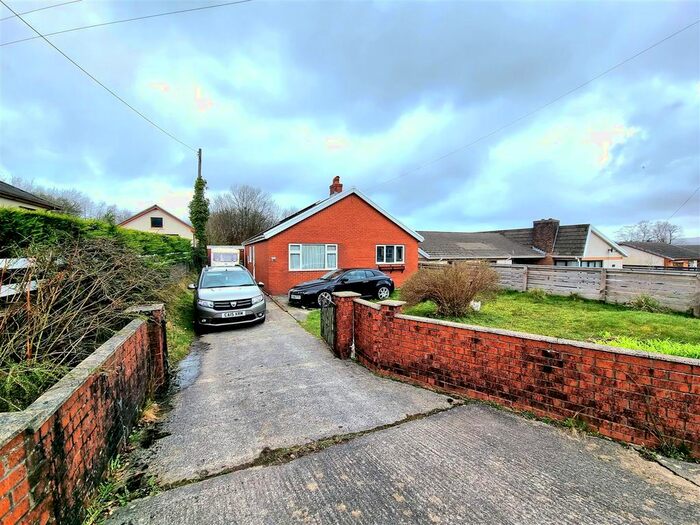
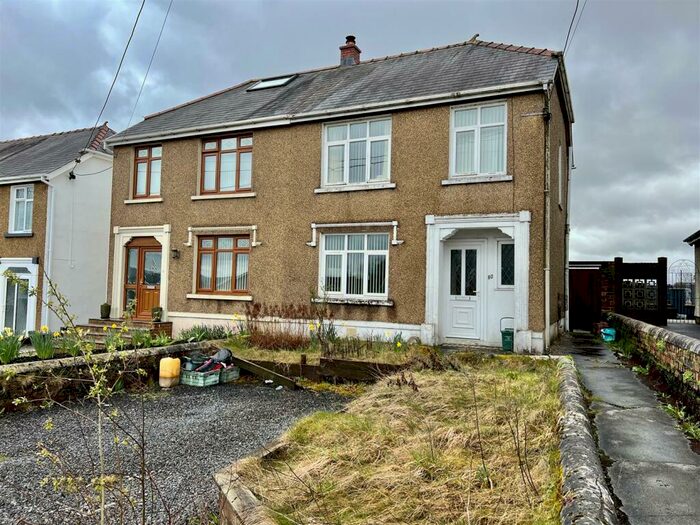
Previously listed properties in Penygroes


Roads and Postcodes in Penygroes
Navigate through our locations to find the location of your next house in Penygroes, Ammanford for sale or to rent.
| Streets | Postcodes |
|---|---|
| Caerbryn Terrace | SA18 3DX |
| Heol Fach | SA18 3DJ |
| Pantyblodau Road | SA18 3BX |
| Penygroes Road | SA18 3BQ SA18 3BZ SA18 3DQ SA18 3EQ |
| SA18 3DZ SA18 3EJ |
Transport near Penygroes

- FAQ
- Price Paid By Year
- Property Type Price
Frequently asked questions about Penygroes
What is the average price for a property for sale in Penygroes?
The average price for a property for sale in Penygroes is £225,652. This amount is 16% higher than the average price in Ammanford. There are 64 property listings for sale in Penygroes.
What streets have the most expensive properties for sale in Penygroes?
The streets with the most expensive properties for sale in Penygroes are Penygroes Road at an average of £227,464 and Pantyblodau Road at an average of £199,687.
What streets have the most affordable properties for sale in Penygroes?
The street with the most affordable properties for sale in Penygroes is Caerbryn Terrace at an average of £125,000.
Which train stations are available in or near Penygroes?
Some of the train stations available in or near Penygroes are Llandybie, Ammanford and Pantyffynnon.
Property Price Paid in Penygroes by Year
The average sold property price by year was:
| Year | Average Sold Price | Price Change |
Sold Properties
|
|---|---|---|---|
| 2023 | £248,581 | 2% |
8 Properties |
| 2022 | £242,416 | 19% |
6 Properties |
| 2021 | £197,250 | 18% |
10 Properties |
| 2020 | £161,895 | 21% |
10 Properties |
| 2019 | £127,833 | -49% |
9 Properties |
| 2018 | £189,888 | -1% |
9 Properties |
| 2017 | £191,625 | 23% |
8 Properties |
| 2016 | £146,735 | 5% |
9 Properties |
| 2015 | £140,050 | 1% |
6 Properties |
| 2014 | £138,666 | 9% |
3 Properties |
| 2013 | £125,500 | -4% |
4 Properties |
| 2012 | £129,987 | 18% |
4 Properties |
| 2011 | £106,816 | -19% |
3 Properties |
| 2010 | £127,500 | 15% |
2 Properties |
| 2009 | £108,500 | -3% |
2 Properties |
| 2008 | £111,500 | -40% |
5 Properties |
| 2007 | £156,500 | 15% |
5 Properties |
| 2006 | £133,166 | 20% |
9 Properties |
| 2005 | £106,916 | -4% |
6 Properties |
| 2004 | £110,741 | 11% |
6 Properties |
| 2003 | £98,763 | 22% |
15 Properties |
| 2002 | £76,613 | 42% |
11 Properties |
| 2001 | £44,550 | 5% |
10 Properties |
| 2000 | £42,273 | 5% |
8 Properties |
| 1999 | £40,093 | -25% |
8 Properties |
| 1998 | £50,300 | 22% |
4 Properties |
| 1997 | £39,314 | -23% |
7 Properties |
| 1996 | £48,208 | 14% |
6 Properties |
| 1995 | £41,250 | - |
6 Properties |
Property Price per Property Type in Penygroes
Here you can find historic sold price data in order to help with your property search.
The average Property Paid Price for specific property types in the last three years are:
| Property Type | Average Sold Price | Sold Properties |
|---|---|---|
| Semi Detached House | £171,087.00 | 8 Semi Detached Houses |
| Terraced House | £125,000.00 | 2 Terraced Houses |
| Detached House | £271,210.00 | 14 Detached Houses |