
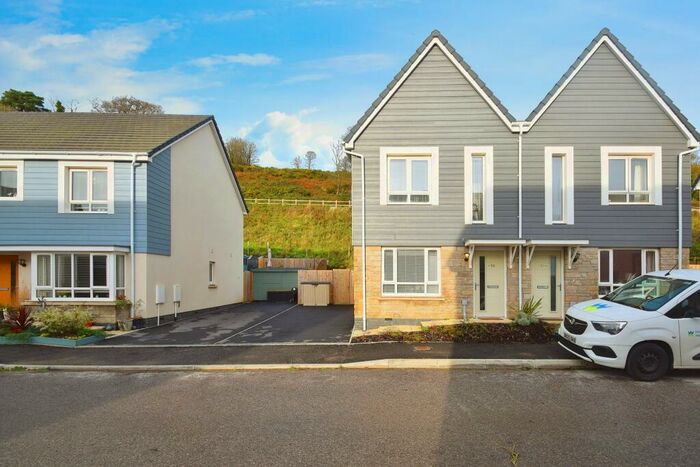
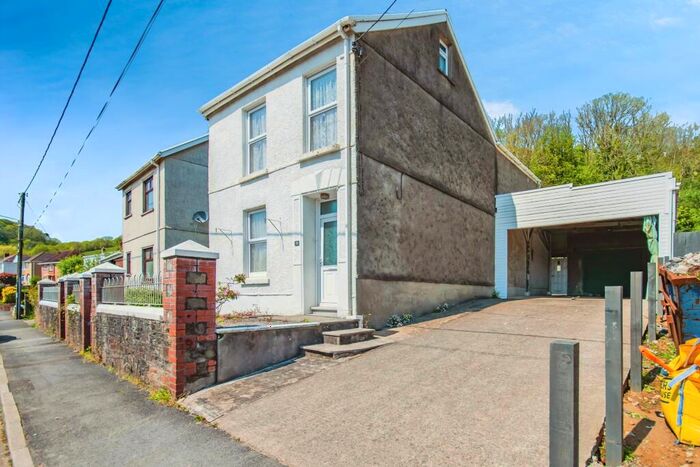
Houses for sale & to rent in Burry Port, Burry Port
House Prices in Burry Port
Properties in Burry Port have an average house price of £173,309.00 and had 172 Property Transactions within the last 3 years¹.
Burry Port is an area in Burry Port, Sir Gaerfyrddin - Carmarthenshire with 1,926 households², where the most expensive property was sold for £502,500.00.
Properties for sale in Burry Port


Previously listed properties in Burry Port

Roads and Postcodes in Burry Port
Navigate through our locations to find the location of your next house in Burry Port, Burry Port for sale or to rent.
| Streets | Postcodes |
|---|---|
| Ardwyn | SA16 0SL |
| Bridge Street | SA16 0NR |
| Brodawel | SA16 0LG |
| Bryn Avenue | SA16 0SG |
| Bryn Gwdig | SA16 0SW |
| Bryn Terrace | SA16 0EE |
| Brynhyfryd | SA16 0PR |
| Burrows Terrace | SA16 0NH |
| Burry Port Industrial Estate | SA16 0NN |
| Caedolau | SA16 0PF |
| Chandlers Yard | SA16 0FE |
| Church Road | SA16 0RY SA16 0SB SA16 0SF |
| Cliff Terrace | SA16 0HR |
| Cliffe Terrace | SA16 0HL SA16 0HN |
| Colby Road | SA16 0PT SA16 0RH SA16 0RL |
| Cwm Ivor Road | SA16 0TA SA16 0RN SA16 0RW |
| Dandorlan Road | SA16 0RA |
| Derwydd Bungalows | SA16 0HE |
| Derwydd Caravan Site | SA16 0EU |
| Derwydd Houses | SA16 0HB |
| Derwydd Road | SA16 0ET |
| Dolau Fan Road | SA16 0RD SA16 0RE SA16 0RF SA16 0RG SA16 0RP |
| Dolycoed Avenue | SA16 0PY |
| Dyfatty Terrace | SA16 0SA |
| Dyffryn | SA16 0TE |
| Elkington Road | SA16 0AD |
| Erw Terrace | SA16 0DA |
| Glanmor Terrace | SA16 0NE SA16 0LS SA16 0NW |
| Glanwern | SA16 0PE |
| Heol Dyfatty | SA16 0SD |
| Heol Elizabeth | SA16 0PA |
| Heol Vaughan | SA16 0HF SA16 0HG |
| Heol Y Felin | SA16 0NY |
| Isgraig | SA16 0DD SA16 0DE |
| Llys Ashburnham | SA16 0GJ |
| Mansel Street | SA16 0BB SA16 0BD |
| Memorial Square | SA16 0FA |
| Morlan Terrace | SA16 0ND |
| Neptune Square | SA16 0EP |
| New Street | SA16 0RT SA16 0RU SA16 0RZ |
| Parc Dyfatty Park | SA16 0FB |
| Parc Tyisha | SA16 0RR SA16 0RS |
| Parc Y Minos Street | SA16 0BN |
| Park Terrace | SA16 0BW |
| Parkes Street | SA16 0NS |
| Pencoed Road | SA16 0PB SA16 0PD SA16 0PJ SA16 0PN SA16 0PS SA16 0PW |
| Penybryn Avenue | SA16 0PU |
| Pinetree Close | SA16 0TF |
| Pwll Road | SA16 0TB |
| Riverside | SA16 0RB |
| Sandfield Road | SA16 0LH SA16 0LL |
| Seaview Terrace | SA16 0EN |
| Silver Terrace | SA16 0NA |
| Snowdon Road | SA16 0BG |
| Springfield Terrace | SA16 0LN |
| St Helena | SA16 0ED |
| St Marys Court | SA16 0GX |
| St Marys Rise | SA16 0SH |
| Station Road | SA16 0LP SA16 0LR SA16 0LW |
| Stepney Road | SA16 0BE SA16 0BH SA16 0BP SA16 0BL SA16 0PL |
| Sussex Road | SA16 0SE |
| Tan Y Bryn | SA16 0HP SA16 0LD |
| Tanycoed | SA16 0SU SA16 0SY |
| The Cliff | SA16 0HW |
| The Crescent | SA16 0PP |
| The Docks | SA16 0LT |
| The Harbour | SA16 0ER |
| The Level | SA16 0ST |
| Ty Fri | SA16 0DS |
| Tyle Teg | SA16 0SN SA16 0SR SA16 0SS |
| Wern Road | SA16 0NU |
| Williams Terrace | SA16 0PG |
| Woodbrook Terrace | SA16 0NF SA16 0NG |
| Y Ddwyberth | SA16 0PH |
| Y Derwydd | SA16 0EY |
| Y Rhodfa | SA16 0SP |
| SA16 0HD SA16 0HH SA16 0NL SA16 0SZ SA16 0FH SA16 0TG SA16 0TJ |
Transport near Burry Port

- FAQ
- Price Paid By Year
- Property Type Price
Frequently asked questions about Burry Port
What is the average price for a property for sale in Burry Port?
The average price for a property for sale in Burry Port is £173,309. This amount is 14% lower than the average price in Burry Port. There are 345 property listings for sale in Burry Port.
What streets have the most expensive properties for sale in Burry Port?
The streets with the most expensive properties for sale in Burry Port are Y Derwydd at an average of £375,000, Parc Tyisha at an average of £310,500 and The Harbour at an average of £265,000.
What streets have the most affordable properties for sale in Burry Port?
The streets with the most affordable properties for sale in Burry Port are Station Road at an average of £57,000, Bridge Street at an average of £74,000 and Woodbrook Terrace at an average of £81,000.
Which train stations are available in or near Burry Port?
Some of the train stations available in or near Burry Port are Pembrey and Burry Port, Llanelli and Kidwelly.
Property Price Paid in Burry Port by Year
The average sold property price by year was:
| Year | Average Sold Price | Price Change |
Sold Properties
|
|---|---|---|---|
| 2024 | £164,311 | 3% |
8 Properties |
| 2023 | £159,946 | -18% |
48 Properties |
| 2022 | £188,914 | 11% |
61 Properties |
| 2021 | £168,972 | 23% |
55 Properties |
| 2020 | £129,999 | -1% |
66 Properties |
| 2019 | £131,788 | 6% |
68 Properties |
| 2018 | £123,812 | -2% |
69 Properties |
| 2017 | £125,707 | 6% |
79 Properties |
| 2016 | £118,033 | 7% |
77 Properties |
| 2015 | £109,802 | -4% |
62 Properties |
| 2014 | £113,801 | 11% |
57 Properties |
| 2013 | £101,744 | -15% |
57 Properties |
| 2012 | £117,294 | 11% |
36 Properties |
| 2011 | £104,211 | -21% |
46 Properties |
| 2010 | £126,544 | 6% |
45 Properties |
| 2009 | £118,860 | -5% |
54 Properties |
| 2008 | £124,227 | 4% |
55 Properties |
| 2007 | £119,469 | 3% |
84 Properties |
| 2006 | £116,256 | 5% |
102 Properties |
| 2005 | £110,214 | 20% |
60 Properties |
| 2004 | £88,663 | 20% |
86 Properties |
| 2003 | £70,878 | 27% |
84 Properties |
| 2002 | £51,749 | 10% |
96 Properties |
| 2001 | £46,346 | 15% |
87 Properties |
| 2000 | £39,426 | -7% |
59 Properties |
| 1999 | £42,255 | 2% |
50 Properties |
| 1998 | £41,592 | 16% |
51 Properties |
| 1997 | £34,959 | -1% |
47 Properties |
| 1996 | £35,409 | 10% |
51 Properties |
| 1995 | £31,931 | - |
38 Properties |
Property Price per Property Type in Burry Port
Here you can find historic sold price data in order to help with your property search.
The average Property Paid Price for specific property types in the last three years are:
| Property Type | Average Sold Price | Sold Properties |
|---|---|---|
| Semi Detached House | £161,459.00 | 53 Semi Detached Houses |
| Detached House | £260,438.00 | 40 Detached Houses |
| Terraced House | £137,546.00 | 72 Terraced Houses |
| Flat | £132,999.00 | 7 Flats |