
Houses for sale & to rent in Cenarth, Newcastle Emlyn
House Prices in Cenarth
Properties in Cenarth have an average house price of £230,339.00 and had 66 Property Transactions within the last 3 years¹.
Cenarth is an area in Newcastle Emlyn, Sir Gaerfyrddin - Carmarthenshire with 928 households², where the most expensive property was sold for £637,000.00.
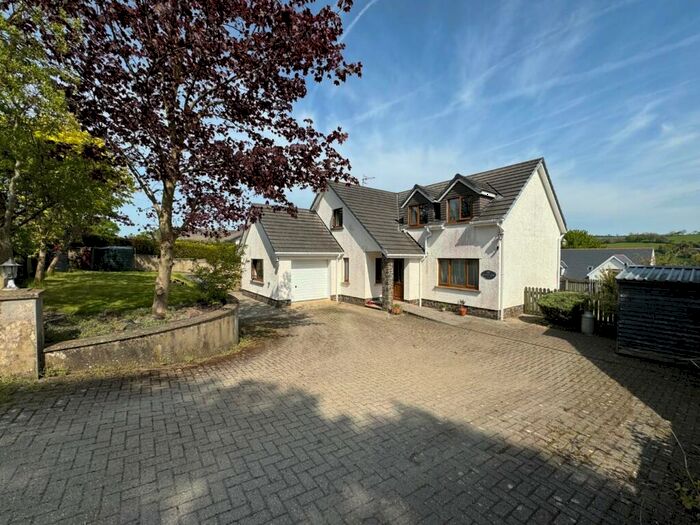
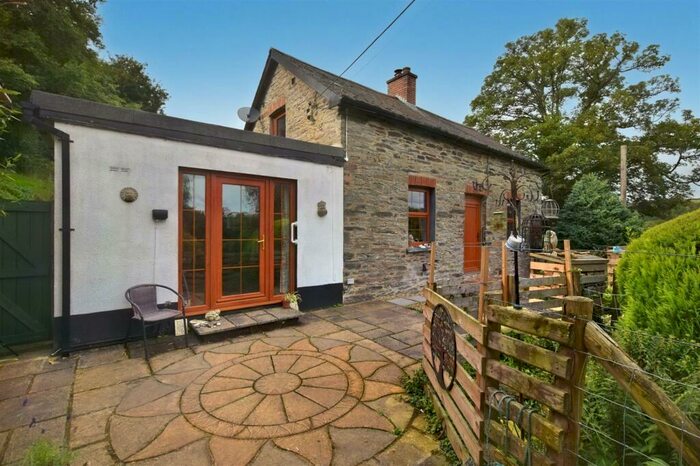
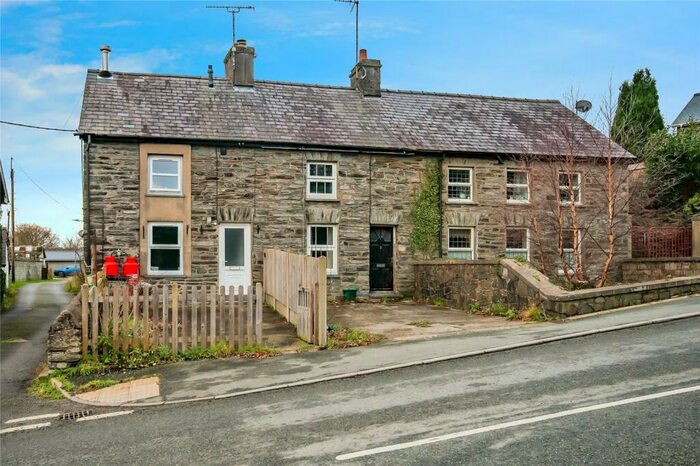
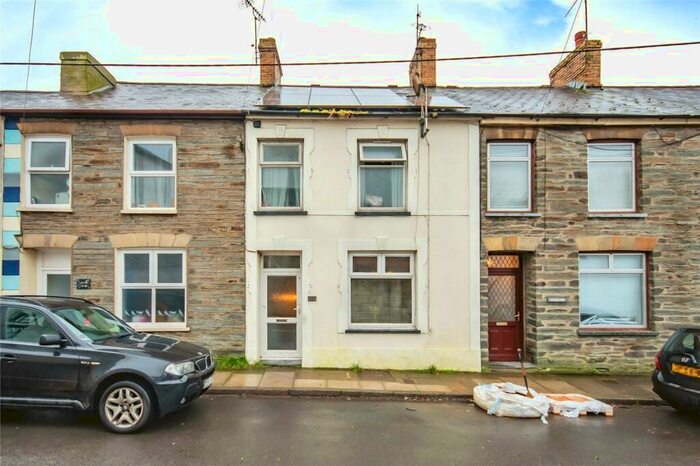
Properties for sale in Cenarth


Roads and Postcodes in Cenarth
Navigate through our locations to find the location of your next house in Cenarth, Newcastle Emlyn for sale or to rent.
Transport near Cenarth

- FAQ
- Price Paid By Year
- Property Type Price
Frequently asked questions about Cenarth
What is the average price for a property for sale in Cenarth?
The average price for a property for sale in Cenarth is £230,339. This amount is 0.45% lower than the average price in Newcastle Emlyn. There are 401 property listings for sale in Cenarth.
What streets have the most expensive properties for sale in Cenarth?
The streets with the most expensive properties for sale in Cenarth are Penlon Road at an average of £324,500, Capel Iwan Road at an average of £309,333 and Carmarthen Road at an average of £258,800.
What streets have the most affordable properties for sale in Cenarth?
The streets with the most affordable properties for sale in Cenarth are Glaziers Row at an average of £102,500, Emlyn Square at an average of £120,000 and Castle Terrace at an average of £127,333.
Which train stations are available in or near Cenarth?
Some of the train stations available in or near Cenarth are Carmarthen, Whitland and Clunderwen.
Property Price Paid in Cenarth by Year
The average sold property price by year was:
| Year | Average Sold Price | Price Change |
Sold Properties
|
|---|---|---|---|
| 2023 | £216,250 | -15% |
14 Properties |
| 2022 | £248,995 | 10% |
22 Properties |
| 2021 | £223,233 | 17% |
30 Properties |
| 2020 | £185,308 | 13% |
24 Properties |
| 2019 | £160,579 | -23% |
25 Properties |
| 2018 | £197,442 | -5% |
28 Properties |
| 2017 | £206,477 | 20% |
24 Properties |
| 2016 | £165,858 | 2% |
36 Properties |
| 2015 | £162,973 | 9% |
29 Properties |
| 2014 | £149,111 | -9% |
27 Properties |
| 2013 | £162,472 | -13% |
18 Properties |
| 2012 | £183,381 | 17% |
19 Properties |
| 2011 | £153,000 | 1% |
17 Properties |
| 2010 | £151,866 | -25% |
15 Properties |
| 2009 | £189,346 | 18% |
13 Properties |
| 2008 | £154,380 | -15% |
18 Properties |
| 2007 | £177,864 | -13% |
34 Properties |
| 2006 | £201,060 | 30% |
39 Properties |
| 2005 | £141,105 | -17% |
19 Properties |
| 2004 | £164,641 | 36% |
46 Properties |
| 2003 | £105,153 | 5% |
38 Properties |
| 2002 | £100,046 | 14% |
45 Properties |
| 2001 | £86,065 | 22% |
29 Properties |
| 2000 | £67,344 | 20% |
29 Properties |
| 1999 | £53,686 | -12% |
33 Properties |
| 1998 | £59,926 | 21% |
24 Properties |
| 1997 | £47,531 | -7% |
22 Properties |
| 1996 | £50,804 | -10% |
21 Properties |
| 1995 | £56,033 | - |
15 Properties |
Property Price per Property Type in Cenarth
Here you can find historic sold price data in order to help with your property search.
The average Property Paid Price for specific property types in the last three years are:
| Property Type | Average Sold Price | Sold Properties |
|---|---|---|
| Semi Detached House | £214,968.00 | 19 Semi Detached Houses |
| Terraced House | £145,705.00 | 17 Terraced Houses |
| Detached House | £296,689.00 | 29 Detached Houses |
| Flat | £37,000.00 | 1 Flat |