
Houses for sale & to rent in Lligwy, Moelfre
House Prices in Lligwy
Properties in Lligwy have an average house price of £316,068.00 and had 47 Property Transactions within the last 3 years¹.
Lligwy is an area in Moelfre, Sir Ynys Mon - Isle of Anglesey with 385 households², where the most expensive property was sold for £596,000.00.
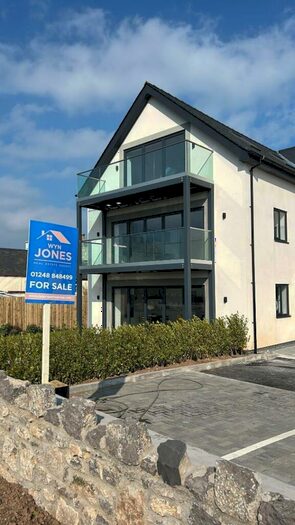
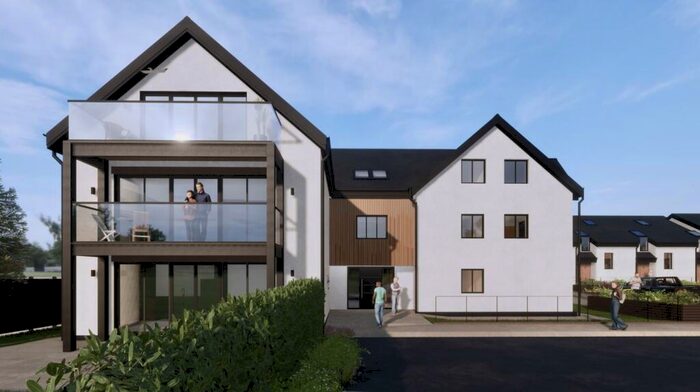
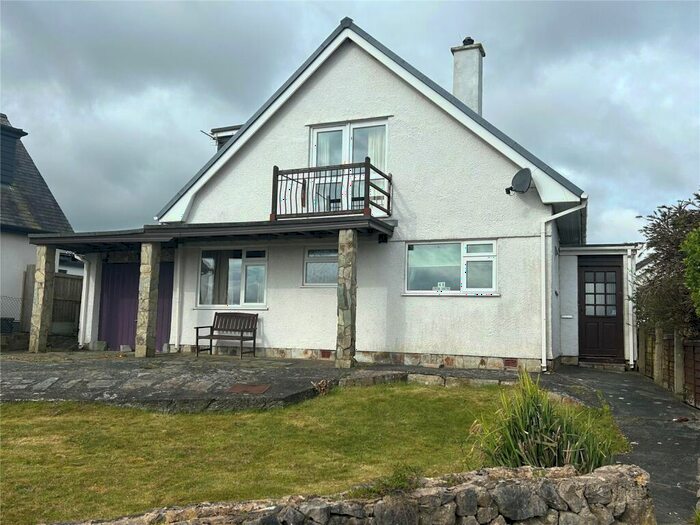
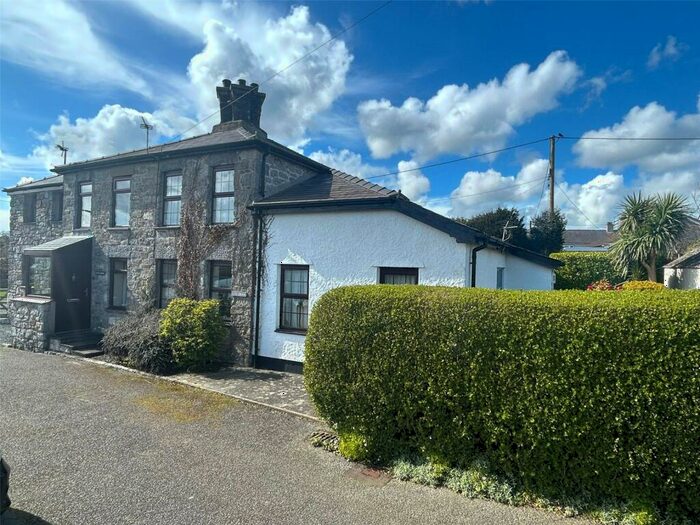
Properties for sale in Lligwy


Roads and Postcodes in Lligwy
Navigate through our locations to find the location of your next house in Lligwy, Moelfre for sale or to rent.
| Streets | Postcodes |
|---|---|
| Ffordd Eleth | LL72 8LU |
| Ffordd Lligwy | LL72 8LS LL72 8LT |
| Ffordd Seiriol | LL72 8LW |
| Maes Hyfryd | LL72 8LR |
| Mor Awelon | LL72 8HS |
| Nant Bychan | LL72 8HE |
| Penrhos Terrace | LL72 8LD |
| Plas Lligwy Cottage | LL72 8NH |
| Rhos Ffordd | LL72 8NW |
| Swn Yr Afon | LL72 8HJ |
| Trigfa Estate | LL72 8LL |
| LL72 8HA LL72 8HB LL72 8HD LL72 8HG LL72 8HH LL72 8HL LL72 8HN LL72 8HR LL72 8HT LL72 8HU LL72 8HW LL72 8HY LL72 8LA LL72 8LB LL72 8LE LL72 8LG LL72 8LH LL72 8LJ LL72 8LN LL72 8LP LL72 8NA LL72 8NE LL72 8NG LL72 8HF LL72 8HP LL72 8LF LL72 8LY LL72 8LZ LL72 8NF LL72 8NL LL72 8NN |
Transport near Lligwy
-
 Llanfairpwll Station
 -
Bangor (Gwynedd) Station
-
Llanfairfechan Station
-
Bodorgan Station
-
Ty Croes Station
-
Rhosneigr Station
-
Valley Station
-
Penmaenmawr Station
- FAQ
- Price Paid By Year
- Property Type Price
Frequently asked questions about Lligwy
What is the average price for a property for sale in Lligwy?
The average price for a property for sale in Lligwy is £316,068. There are 59 property listings for sale in Lligwy.
What streets have the most expensive properties for sale in Lligwy?
The streets with the most expensive properties for sale in Lligwy are Nant Bychan at an average of £368,000, Ffordd Eleth at an average of £335,000 and Trigfa Estate at an average of £333,812.
What streets have the most affordable properties for sale in Lligwy?
The streets with the most affordable properties for sale in Lligwy are Ffordd Lligwy at an average of £166,002, Maes Hyfryd at an average of £244,100 and Rhos Ffordd at an average of £244,500.
Which train stations are available in or near Lligwy?
Some of the train stations available in or near Lligwy are Llanfairpwll, Bangor (Gwynedd) and Llanfairfechan.
Property Price Paid in Lligwy by Year
The average sold property price by year was:
| Year | Average Sold Price | Price Change |
Sold Properties
|
|---|---|---|---|
| 2024 | £313,750 | -1% |
2 Properties |
| 2023 | £317,050 | 7% |
9 Properties |
| 2022 | £294,214 | -19% |
22 Properties |
| 2021 | £350,110 | 32% |
14 Properties |
| 2020 | £237,249 | 5% |
17 Properties |
| 2019 | £226,200 | -14% |
20 Properties |
| 2018 | £257,627 | 22% |
27 Properties |
| 2017 | £202,193 | 8% |
15 Properties |
| 2016 | £186,227 | 3% |
11 Properties |
| 2015 | £180,526 | 4% |
19 Properties |
| 2014 | £173,062 | 1% |
16 Properties |
| 2013 | £171,892 | 4% |
14 Properties |
| 2012 | £165,763 | -1% |
15 Properties |
| 2011 | £167,348 | -40% |
13 Properties |
| 2010 | £234,461 | 28% |
13 Properties |
| 2009 | £168,571 | -20% |
7 Properties |
| 2008 | £202,833 | 7% |
6 Properties |
| 2007 | £187,893 | -5% |
15 Properties |
| 2006 | £197,205 | 11% |
17 Properties |
| 2005 | £174,656 | -4% |
16 Properties |
| 2004 | £180,836 | 35% |
25 Properties |
| 2003 | £117,725 | 17% |
20 Properties |
| 2002 | £97,301 | 14% |
28 Properties |
| 2001 | £83,594 | 16% |
37 Properties |
| 2000 | £70,340 | 19% |
21 Properties |
| 1999 | £57,150 | -22% |
15 Properties |
| 1998 | £69,519 | 11% |
23 Properties |
| 1997 | £61,704 | 5% |
12 Properties |
| 1996 | £58,475 | 6% |
20 Properties |
| 1995 | £54,900 | - |
10 Properties |
Property Price per Property Type in Lligwy
Here you can find historic sold price data in order to help with your property search.
The average Property Paid Price for specific property types in the last three years are:
| Property Type | Average Sold Price | Sold Properties |
|---|---|---|
| Detached House | £365,801.00 | 28 Detached Houses |
| Terraced House | £247,554.00 | 14 Terraced Houses |
| Semi Detached House | £254,249.00 | 4 Semi Detached Houses |
| Flat | £130,000.00 | 1 Flat |