
Houses for sale & to rent in Twrcelyn, Penysarn
House Prices in Twrcelyn
Properties in Twrcelyn have an average house price of £212,620.00 and had 31 Property Transactions within the last 3 years¹.
Twrcelyn is an area in Penysarn, Sir Ynys Mon - Isle of Anglesey with 315 households², where the most expensive property was sold for £420,000.00.
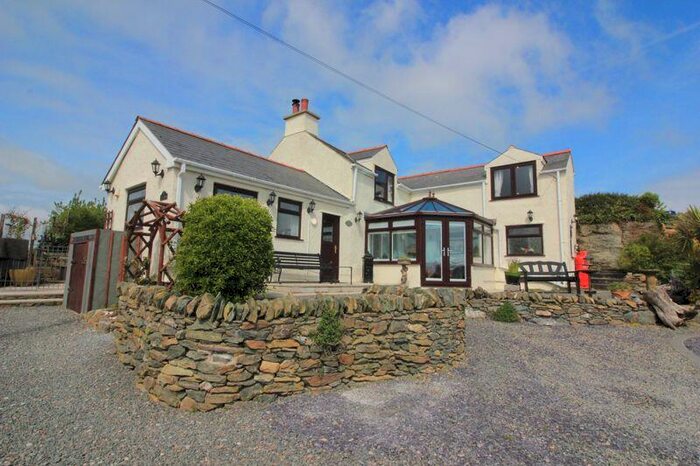
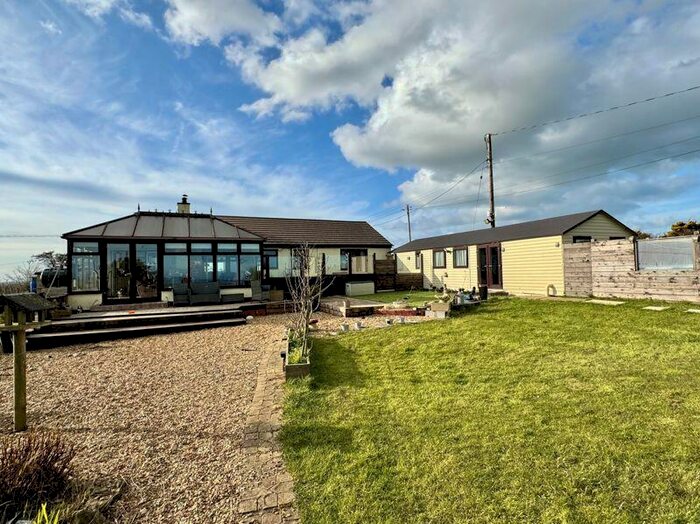
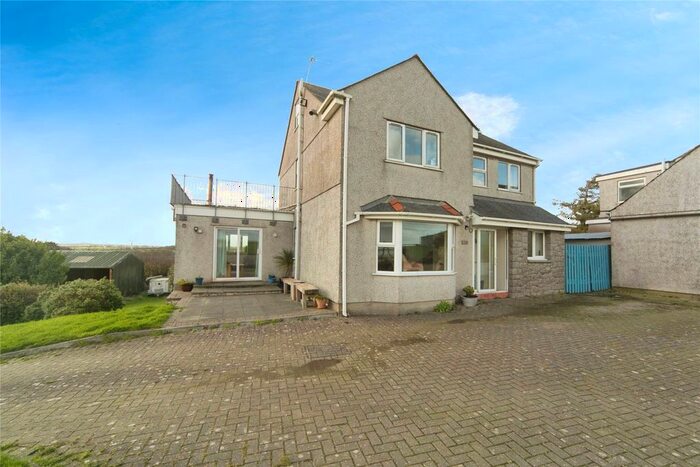
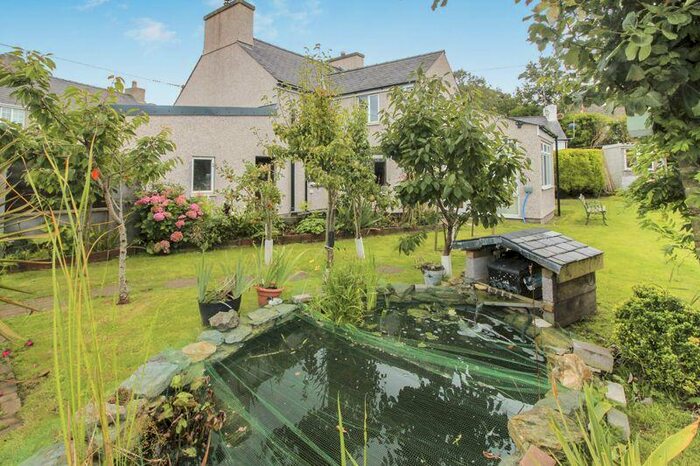
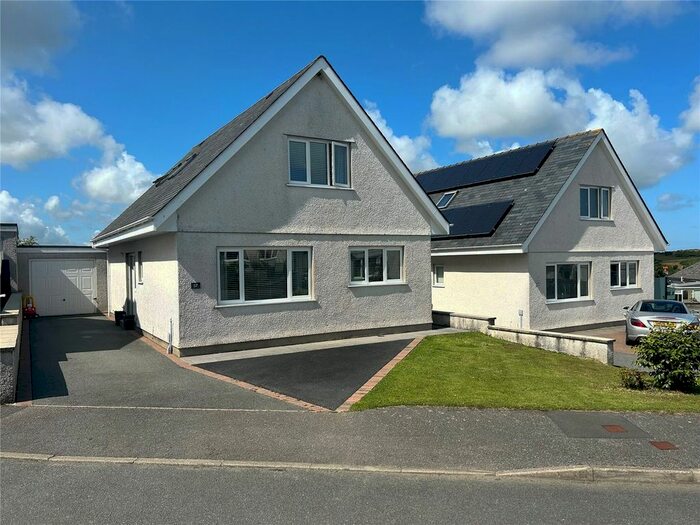
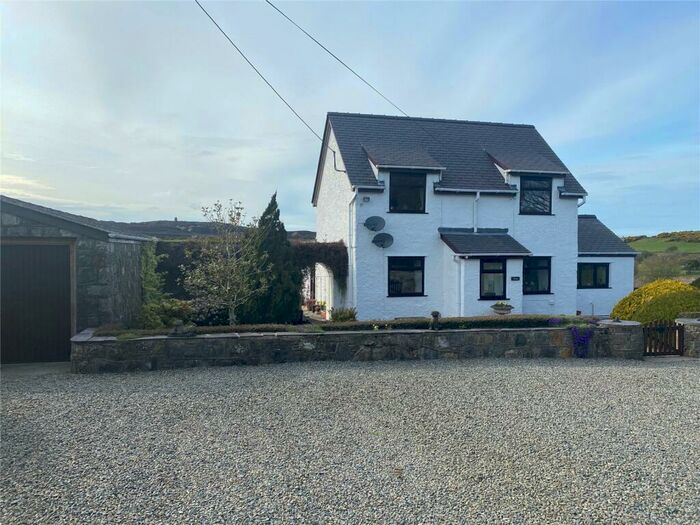
Properties for sale in Twrcelyn


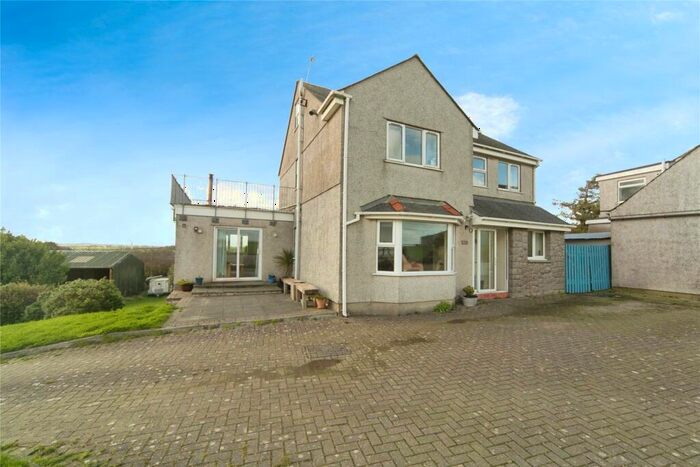
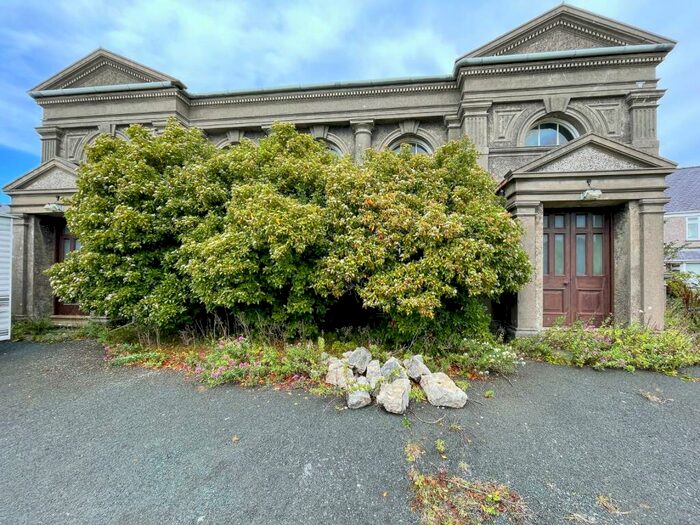
Previously listed properties in Twrcelyn


Roads and Postcodes in Twrcelyn
Navigate through our locations to find the location of your next house in Twrcelyn, Penysarn for sale or to rent.
| Streets | Postcodes |
|---|---|
| Allt Nebo | LL69 9BJ |
| Bryntirion | LL69 9YW |
| Chapel Street | LL69 9YP |
| Lletroed Fawr | LL69 9YG |
| Maes Lletroed | LL69 9YQ |
| Penysarn Fawr Estate | LL69 9BX |
| School Lane | LL69 9AZ |
| Tai Fry | LL69 9UT |
| Tyn Rhos Estate | LL69 9BZ |
| Tyn Y Coed Estate | LL69 9UN |
| LL69 9AJ LL69 9AQ LL69 9AX LL69 9BQ LL69 9UE LL69 9UF LL69 9UG LL69 9UH LL69 9UL LL69 9UP LL69 9YA LL69 9YB LL69 9YD LL69 9YE LL69 9YH LL69 9YL LL69 9YR LL69 9YS LL69 9YU LL69 9YY LL69 9AB LL69 9UR LL69 9YF LL69 9YN LL69 9YT |
Transport near Twrcelyn
-
 Llanfairpwll Station
 -
Valley Station
-
Ty Croes Station
-
Rhosneigr Station
-
Bodorgan Station
-
Bangor (Gwynedd) Station
-
Holyhead Station
- FAQ
- Price Paid By Year
- Property Type Price
Frequently asked questions about Twrcelyn
What is the average price for a property for sale in Twrcelyn?
The average price for a property for sale in Twrcelyn is £212,620. There are 74 property listings for sale in Twrcelyn.
What streets have the most expensive properties for sale in Twrcelyn?
The streets with the most expensive properties for sale in Twrcelyn are Lletroed Fawr at an average of £260,000 and Penysarn Fawr Estate at an average of £222,500.
What streets have the most affordable properties for sale in Twrcelyn?
The streets with the most affordable properties for sale in Twrcelyn are Chapel Street at an average of £141,475 and Tyn Rhos Estate at an average of £183,938.
Which train stations are available in or near Twrcelyn?
Some of the train stations available in or near Twrcelyn are Llanfairpwll, Valley and Ty Croes.
Property Price Paid in Twrcelyn by Year
The average sold property price by year was:
| Year | Average Sold Price | Price Change |
Sold Properties
|
|---|---|---|---|
| 2023 | £201,533 | -6% |
6 Properties |
| 2022 | £213,750 | -1% |
10 Properties |
| 2021 | £216,303 | 10% |
15 Properties |
| 2020 | £194,039 | 23% |
14 Properties |
| 2019 | £148,928 | 1% |
14 Properties |
| 2018 | £147,156 | -20% |
16 Properties |
| 2017 | £177,100 | 14% |
9 Properties |
| 2016 | £152,318 | -13% |
11 Properties |
| 2015 | £172,777 | -0,5% |
9 Properties |
| 2014 | £173,555 | 14% |
9 Properties |
| 2013 | £149,375 | -1% |
8 Properties |
| 2012 | £151,438 | -0,2% |
9 Properties |
| 2011 | £151,750 | -24% |
4 Properties |
| 2010 | £188,200 | 37% |
5 Properties |
| 2009 | £118,200 | -6% |
5 Properties |
| 2008 | £125,200 | -26% |
5 Properties |
| 2007 | £157,350 | 16% |
14 Properties |
| 2006 | £132,760 | -26% |
15 Properties |
| 2005 | £167,842 | 26% |
13 Properties |
| 2004 | £124,429 | 26% |
17 Properties |
| 2003 | £91,750 | 28% |
10 Properties |
| 2002 | £65,875 | 29% |
16 Properties |
| 2001 | £46,772 | -16% |
11 Properties |
| 2000 | £54,397 | 7% |
20 Properties |
| 1999 | £50,574 | 13% |
11 Properties |
| 1998 | £43,806 | -21% |
8 Properties |
| 1997 | £53,057 | 13% |
12 Properties |
| 1996 | £46,075 | 40% |
8 Properties |
| 1995 | £27,500 | - |
6 Properties |
Property Price per Property Type in Twrcelyn
Here you can find historic sold price data in order to help with your property search.
The average Property Paid Price for specific property types in the last three years are:
| Property Type | Average Sold Price | Sold Properties |
|---|---|---|
| Semi Detached House | £154,500.00 | 5 Semi Detached Houses |
| Terraced House | £134,825.00 | 6 Terraced Houses |
| Detached House | £250,490.00 | 20 Detached Houses |